Specialty Real Estate
2915 North 3rd Street Harrisburg, PA 17110
2915 North 3rd Street Harrisburg, PA 17110
Details & Description
Property Highlights
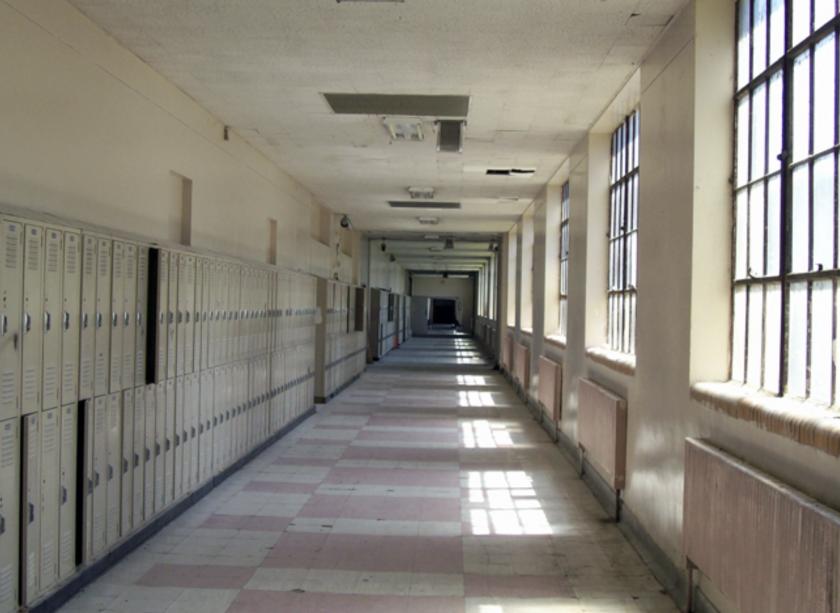
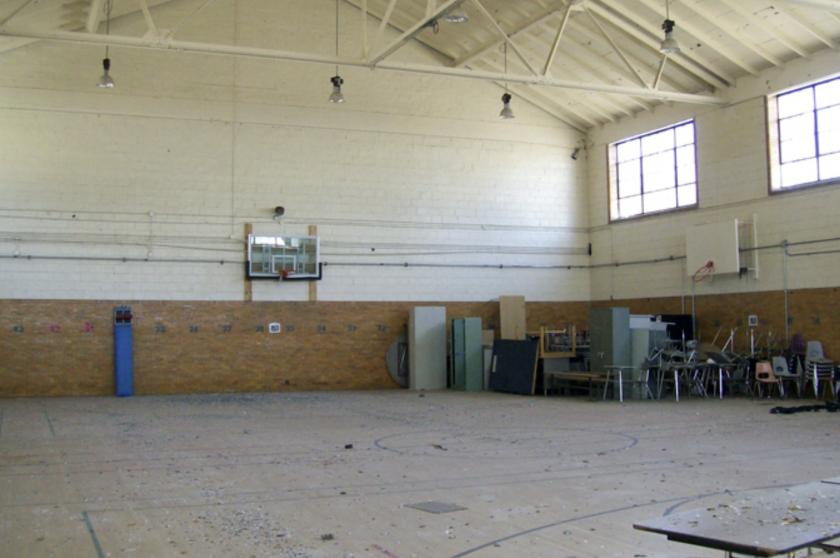
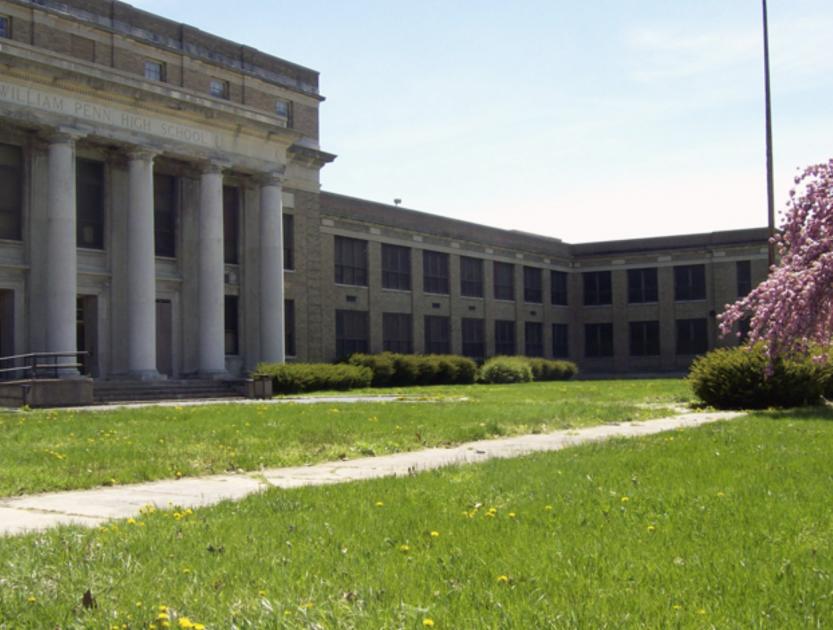
• 222,000 plus sq. ft. building with a large auditorium, gymnasium, dozens of classrooms and offices.
• Steps away from Italian Lake, minutes to I-81 and Downtown Capital Complex.
Listing Agents

Seymour Barget
O: 717-731-1990
M: 717-623-2007
sbarget@landmarkcr.com
O: 717-731-1990
M: 717-623-2007
sbarget@landmarkcr.com
While we strive to provide the most accurate information, all listing information, and demographic data, is provided by third-parties. As such, MyEListing will not be responsible for the accuracy of the information. It is strongly recommended that you verify all information with the listing agent, and any relevant agencies, prior to making any decisions.