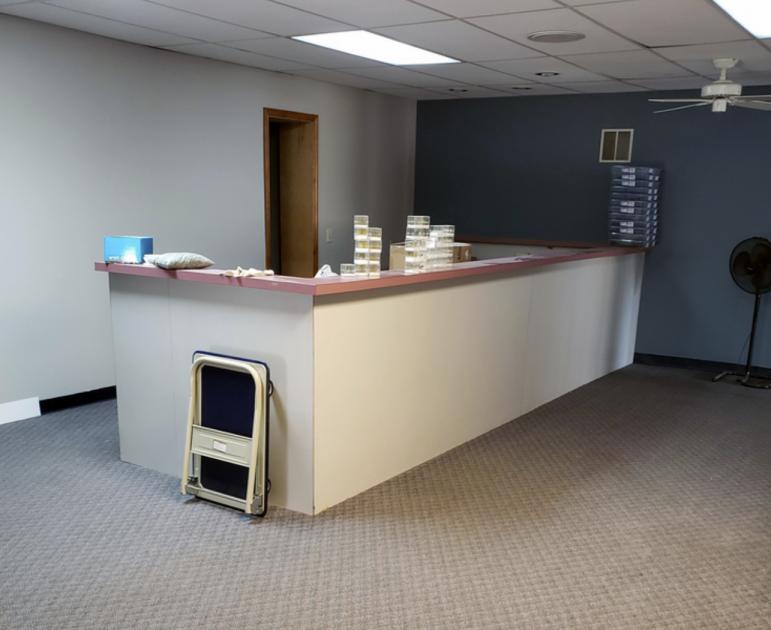
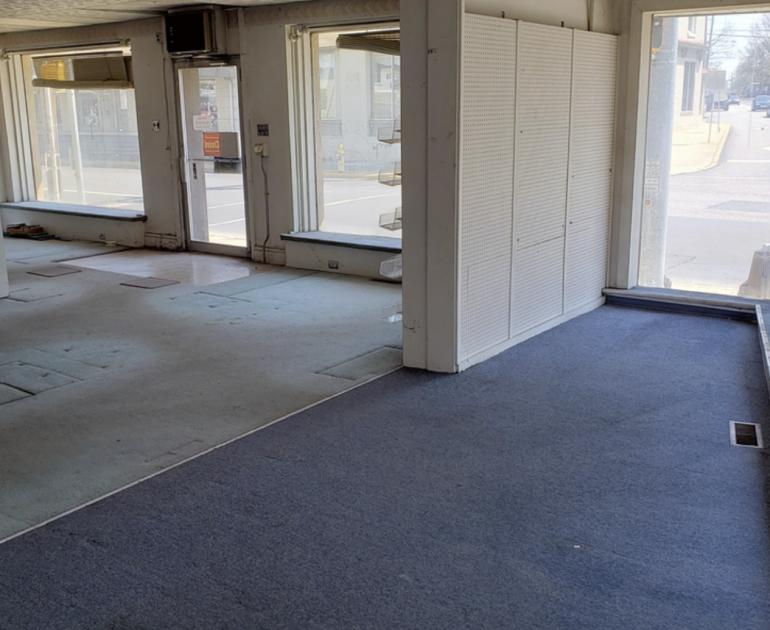
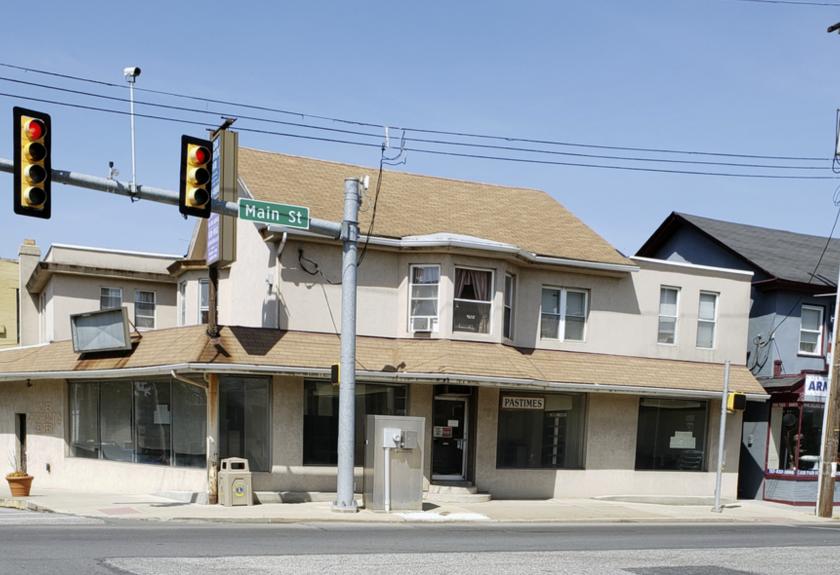
1-Mile | 3-Miles | 5-Miles | ||
---|---|---|---|---|
Total Population | 9,029 | 25,302 | 47,230 | |
Population Median Age | 40 | 42 | 41 | |
Population by Age | 0-9 Yrs | 1229 (13%) | 2793 (11%) | 4616 (9%) |
10-19 Yrs | 967 (10%) | 2836 (11%) | 6345 (13%) | |
20-29 Yrs | 1261 (13%) | 2735 (10%) | 5866 (12%) | |
30-39 Yrs | 1116 (12%) | 2968 (11%) | 5063 (10%) | |
40-49 Yrs | 1116 (12%) | 3691 (14%) | 6594 (13%) | |
50-59 Yrs | 1117 (12%) | 3081 (12%) | 5937 (12%) | |
60-69 Yrs | 1032 (11%) | 3706 (14%) | 6736 (14%) | |
70+ Yrs | 1193 (13%) | 3494 (13%) | 6072 (12%) | |
Median HH Income | $54,657 | $63,494 | $66,897 | |
Total Household Income | < 24K | 780 (19%) | 1520 (14%) | 2699 (14%) |
25-49K | 996 (25%) | 2408 (23%) | 3868 (21%) | |
50-74K | 916 (23%) | 2118 (20%) | 3524 (19%) | |
75-99K | 603 (15%) | 1620 (15%) | 2836 (15%) | |
100-199K | 558 (14%) | 2309 (22%) | 4067 (22%) | |
200K+ | 113 (2%) | 392 (3%) | 1243 (6%) | |
Highest Education Level | No Diploma | 402 | 1375 | 2831 |
Diploma or GED | 2562 | 6294 | 10332 | |
Some College | 1087 | 2724 | 4681 | |
Assoc. Degree | 532 | 1974 | 3524 | |
Bachelors Degree | 965 | 3673 | 6820 | |
Higher Degree | 602 | 2204 | 4778 | |
Total Housing Units | 4,264 | 10,943 | 19,399 | |
--Owner-Occupied | 2,180 | 6,826 | 11,986 | |
--Renter-Occupied | 1,786 | 3,541 | 6,251 | |
Owner-Occupied Values | < 100K | 245 | 556 | 1027 |
100-199K | 1234 | 2928 | 4512 | |
200-299K | 534 | 2415 | 3816 | |
300-399K | 124 | 634 | 1607 | |
400-499K | 34 | 209 | 597 | |
500K+ | 9 | 83 | 427 | |
Total Working Age Population | 7,127 | 20,647 | 39,117 | |
In Work Force | 4,904 | 14,159 | 26,182 | |
Not In Work Force | 2,222 | 6,488 | 12,936 | |
Workforce Employed | 4,706 | 13,609 | 25,261 | |
Workforce Unemployed | 186 | 507 | 869 | |
Civlian Workforce | 4,892 | 14,116 | 26,130 | |
Military Workforce | 13 | 43 | 51 | |
Total Households | 3,966 | 10,367 | 18,237 | |
Family Households | 2,270 | 6,788 | 11,958 | |
Non-Family Households | 1,697 | 3,579 | 6,279 | |
Married Couple | 1,586 | 5,315 | 9,546 | |
Other Family | 683 | 1,473 | 2,412 | |
Married w/Child | 575 | 1,821 | 3,285 | |
Single Male w/Child | 205 | 315 | 506 | |
Single Female w/Child | 301 | 607 | 864 |
Population Change Last Two Decades - Plus Projection
2000 | % | 2010 | % | 2020 | % | 2030 | |
---|---|---|---|---|---|---|---|
Pennsylvania | 12,281,054 | +3 | 12,702,379 | +4 | 13,230,170 | +4 | 13,759,594 |
Dauphin County | 251,798 | +6 | 268,100 | +4 | 279,506 | +3 | 289,132 |
Lancaster County | 470,658 | +10 | 519,445 | +8 | 559,247 | +8 | 602,153 |
Lebanon County | 120,327 | +11 | 133,568 | +4 | 139,272 | +5 | 145,663 |
Total Working Age Population:
Total Households:
Total Working Age Population:
Total Households:
Total Working Age Population:
Total Households: