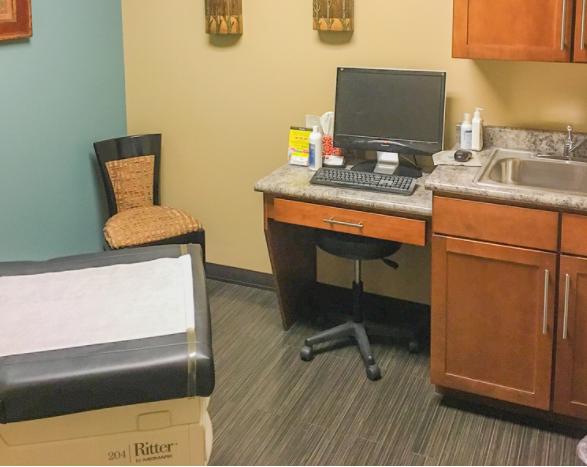
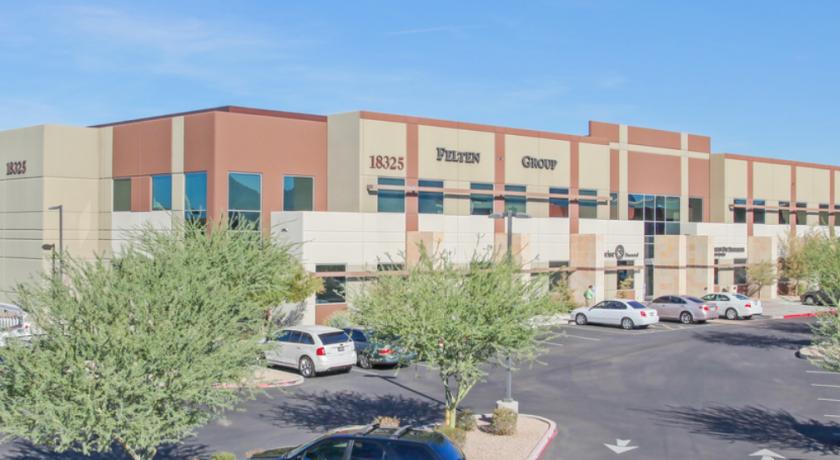
1-Mile | 3-Miles | 5-Miles | ||
---|---|---|---|---|
Total Population | 2,458 | 54,814 | 178,168 | |
Population Median Age | 47 | 42 | 42 | |
Population by Age | 0-9 Yrs | 102 (4%) | 5784 (10%) | 18531 (10%) |
10-19 Yrs | 37 (1%) | 5770 (10%) | 20551 (11%) | |
20-29 Yrs | 521 (21%) | 5793 (10%) | 18470 (10%) | |
30-39 Yrs | 442 (17%) | 7876 (14%) | 23284 (13%) | |
40-49 Yrs | 187 (7%) | 7084 (12%) | 24418 (13%) | |
50-59 Yrs | 370 (15%) | 7781 (14%) | 26834 (15%) | |
60-69 Yrs | 331 (13%) | 7645 (13%) | 22950 (12%) | |
70+ Yrs | 468 (19%) | 7080 (12%) | 23130 (12%) | |
Median HH Income | $77,284 | $97,071 | $92,796 | |
Total Household Income | < 24K | 208 (13%) | 2198 (9%) | 7316 (9%) |
25-49K | 217 (14%) | 3384 (14%) | 11407 (15%) | |
50-74K | 311 (20%) | 3420 (14%) | 11113 (14%) | |
75-99K | 217 (14%) | 3226 (13%) | 10133 (13%) | |
100-199K | 429 (28%) | 7548 (31%) | 21996 (29%) | |
200K+ | 129 (8%) | 3923 (16%) | 12135 (16%) | |
Highest Education Level | No Diploma | 23 | 995 | 4887 |
Diploma or GED | 231 | 4979 | 18385 | |
Some College | 454 | 7019 | 24379 | |
Assoc. Degree | 94 | 2718 | 9928 | |
Bachelors Degree | 888 | 15675 | 44383 | |
Higher Degree | 431 | 9816 | 29470 | |
Total Housing Units | 2,051 | 28,381 | 84,220 | |
--Owner-Occupied | 390 | 13,593 | 47,631 | |
--Renter-Occupied | 1,119 | 10,105 | 26,471 | |
Owner-Occupied Values | < 100K | 10 | 159 | 1244 |
100-199K | 20 | 482 | 2696 | |
200-299K | 89 | 1286 | 6751 | |
300-399K | 90 | 2520 | 10214 | |
400-499K | 42 | 2784 | 8435 | |
500K+ | 138 | 6361 | 18290 | |
Total Working Age Population | 2,338 | 45,275 | 146,505 | |
In Work Force | 1,546 | 29,552 | 97,152 | |
Not In Work Force | 792 | 15,723 | 49,353 | |
Workforce Employed | 1,506 | 28,726 | 93,475 | |
Workforce Unemployed | 39 | 826 | 3,641 | |
Civlian Workforce | 1,546 | 29,552 | 97,116 | |
Military Workforce | 0 | 0 | 36 | |
Total Households | 1,510 | 23,697 | 74,102 | |
Family Households | 543 | 14,477 | 46,114 | |
Non-Family Households | 967 | 9,221 | 27,988 | |
Married Couple | 389 | 12,128 | 37,569 | |
Other Family | 154 | 2,349 | 8,545 | |
Married w/Child | 23 | 4,520 | 14,399 | |
Single Male w/Child | 21 | 280 | 1,191 | |
Single Female w/Child | 38 | 952 | 3,129 |
Population Change Last Two Decades - Plus Projection
2000 | % | 2010 | % | 2020 | % | 2030 | |
---|---|---|---|---|---|---|---|
Arizona | 5,130,632 | +25 | 6,392,017 | +14 | 7,286,100 | +14 | 8,284,900 |
Maricopa County | 3,072,149 | +24 | 3,817,117 | +16 | 4,436,900 | +15 | 5,107,700 |
Total Working Age Population:
Total Households:
Total Working Age Population:
Total Households:
Total Working Age Population:
Total Households: