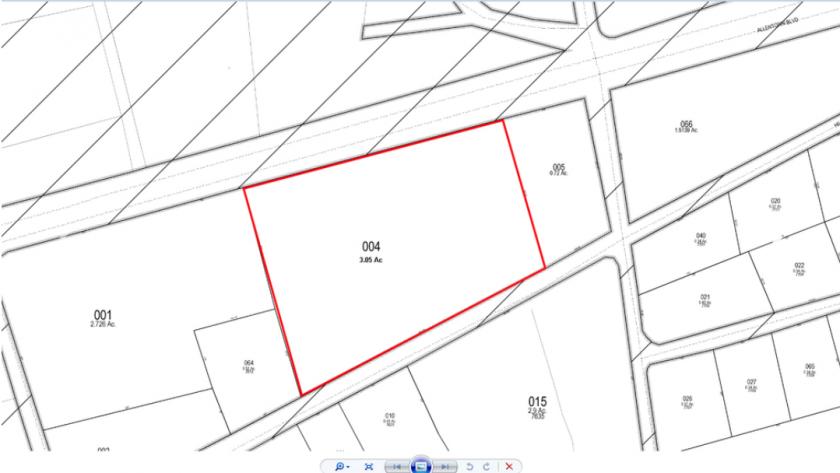
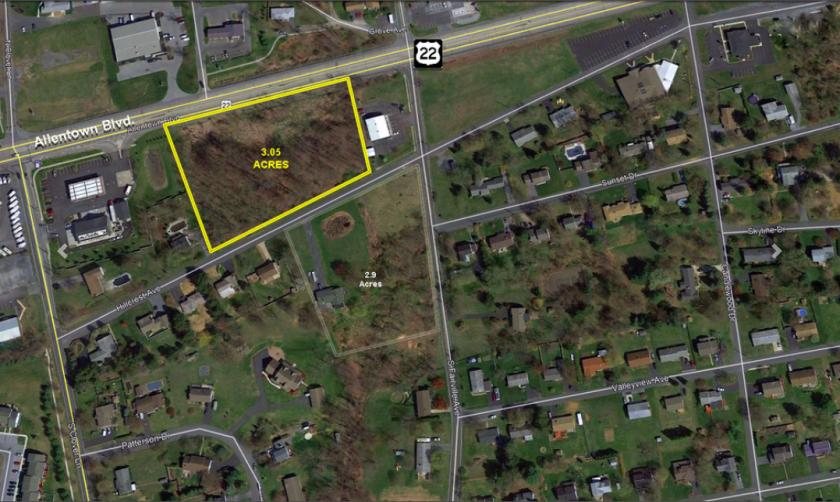
1-Mile | 3-Miles | 5-Miles | ||
---|---|---|---|---|
Total Population | 3,028 | 19,128 | 60,406 | |
Population Median Age | 44 | 42 | 40 | |
Population by Age | 0-9 Yrs | 321 (10%) | 2157 (11%) | 6404 (10%) |
10-19 Yrs | 298 (9%) | 2135 (11%) | 7949 (13%) | |
20-29 Yrs | 294 (9%) | 2125 (11%) | 7273 (12%) | |
30-39 Yrs | 375 (12%) | 2323 (12%) | 7883 (13%) | |
40-49 Yrs | 325 (10%) | 2250 (11%) | 7800 (12%) | |
50-59 Yrs | 425 (14%) | 3046 (15%) | 8521 (14%) | |
60-69 Yrs | 658 (21%) | 3146 (16%) | 8522 (14%) | |
70+ Yrs | 334 (11%) | 1947 (10%) | 6056 (10%) | |
Median HH Income | $92,873 | $90,060 | $78,516 | |
Total Household Income | < 24K | 89 (7%) | 670 (9%) | 2646 (10%) |
25-49K | 122 (10%) | 991 (13%) | 4105 (17%) | |
50-74K | 219 (18%) | 1251 (16%) | 4803 (19%) | |
75-99K | 240 (19%) | 1286 (17%) | 3605 (14%) | |
100-199K | 432 (35%) | 2313 (31%) | 6895 (28%) | |
200K+ | 101 (8%) | 863 (11%) | 2068 (8%) | |
Highest Education Level | No Diploma | 45 | 483 | 2068 |
Diploma or GED | 835 | 4276 | 13339 | |
Some College | 297 | 2051 | 6537 | |
Assoc. Degree | 292 | 1434 | 4191 | |
Bachelors Degree | 480 | 3506 | 10380 | |
Higher Degree | 381 | 2263 | 6312 | |
Total Housing Units | 1,325 | 7,792 | 25,380 | |
--Owner-Occupied | 1,141 | 6,453 | 18,460 | |
--Renter-Occupied | 62 | 920 | 5,663 | |
Owner-Occupied Values | < 100K | 98 | 402 | 1017 |
100-199K | 378 | 2047 | 7809 | |
200-299K | 374 | 2003 | 5467 | |
300-399K | 222 | 1218 | 2435 | |
400-499K | 11 | 350 | 871 | |
500K+ | 58 | 434 | 861 | |
Total Working Age Population | 2,508 | 15,591 | 48,984 | |
In Work Force | 1,498 | 10,255 | 33,503 | |
Not In Work Force | 1,010 | 5,336 | 15,480 | |
Workforce Employed | 1,446 | 9,908 | 32,381 | |
Workforce Unemployed | 48 | 323 | 1,055 | |
Civlian Workforce | 1,495 | 10,231 | 33,436 | |
Military Workforce | 3 | 24 | 67 | |
Total Households | 1,203 | 7,373 | 24,123 | |
Family Households | 923 | 5,579 | 16,613 | |
Non-Family Households | 280 | 1,794 | 7,510 | |
Married Couple | 870 | 4,853 | 13,553 | |
Other Family | 53 | 725 | 3,060 | |
Married w/Child | 280 | 1,621 | 5,001 | |
Single Male w/Child | 0 | 75 | 344 | |
Single Female w/Child | 23 | 256 | 1,061 |
Population Change Last Two Decades - Plus Projection
2000 | % | 2010 | % | 2020 | % | 2030 | |
---|---|---|---|---|---|---|---|
Pennsylvania | 12,281,054 | +3 | 12,702,379 | +4 | 13,230,170 | +4 | 13,759,594 |
Dauphin County | 251,798 | +6 | 268,100 | +4 | 279,506 | +3 | 289,132 |
Lancaster County | 470,658 | +10 | 519,445 | +8 | 559,247 | +8 | 602,153 |
Lebanon County | 120,327 | +11 | 133,568 | +4 | 139,272 | +5 | 145,663 |
Total Working Age Population:
Total Households:
Total Working Age Population:
Total Households:
Total Working Age Population:
Total Households: