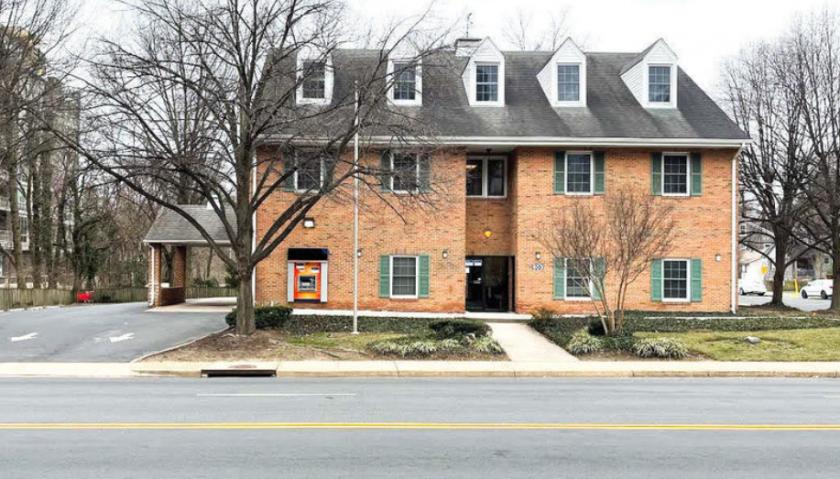
Retail Space
603 West Broad Street Falls Church, VA 22046
603 West Broad Street Falls Church, VA 22046
Details & Description
Property Highlights
• Located on a prominent corner of West Broad Street S Lee Street
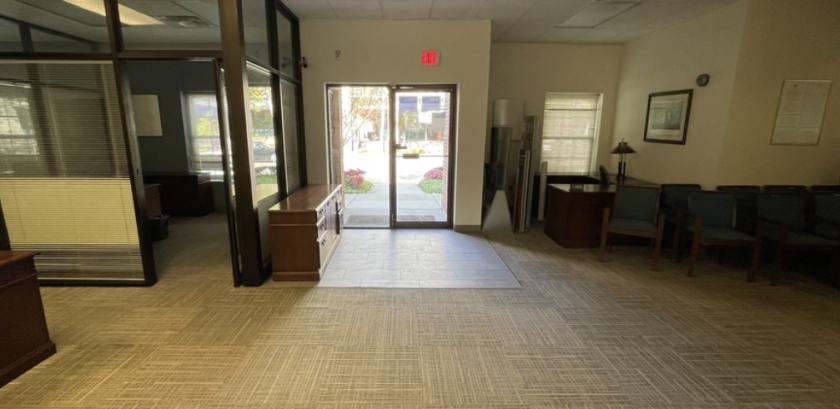
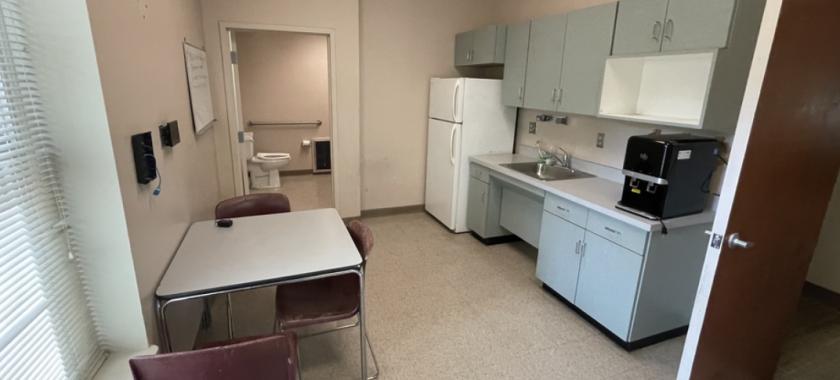
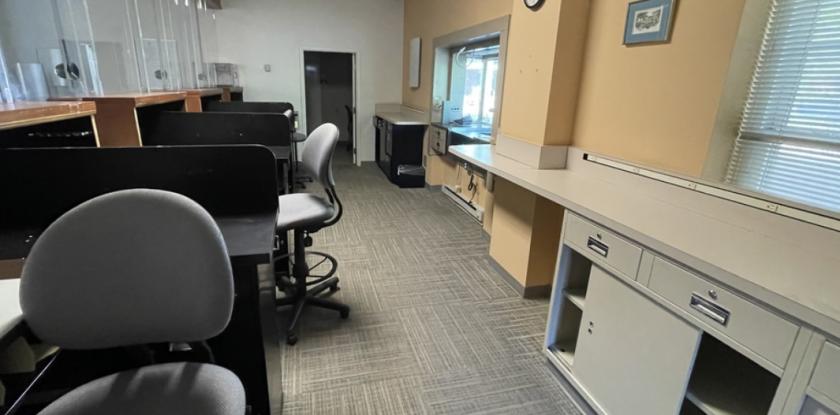
• Each floor consists of 2,880 SF which can be leased separately
Additional Photos
Listing Agents

Erik Ulsaker
O: 703-506-2850
M: 703-861-0373
eu@lnf.com
O: 703-506-2850
M: 703-861-0373
eu@lnf.com

Matthew Garcia
O: 703-506-2850
mgarcia@lnf.com
O: 703-506-2850
mgarcia@lnf.com
While we strive to provide the most accurate information, all listing information, and demographic data, is provided by third-parties. As such, MyEListing will not be responsible for the accuracy of the information. It is strongly recommended that you verify all information with the listing agent, and any relevant agencies, prior to making any decisions.


