Commercial Land
2901 Linglestown Road Harrisburg, PA 17110
2901 Linglestown Road Harrisburg, PA 17110
Details & Description
Property Highlights
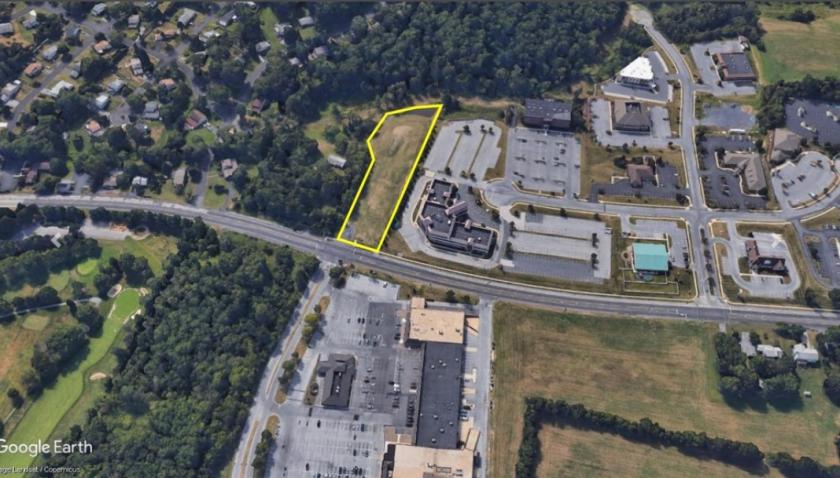
• Excellent location with lighted intersection, great access to amenities and major routes including I-83, I-81 and Rt. 3
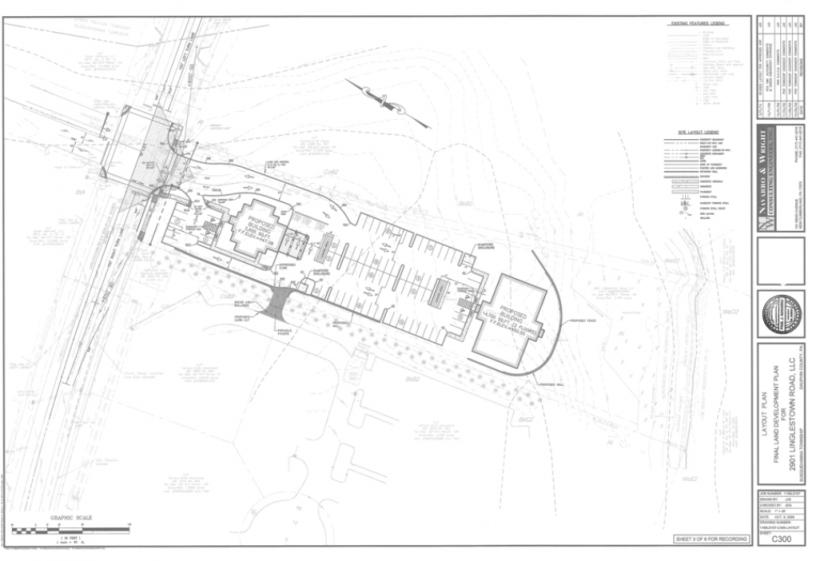
• Site approved for a pad site to accommodate a 4,000 SF building Bank with Drive-thru and a 14,000 SF 2-story office
Listing Agents

Chuck Heller
O: 717-731-1990
cheller@landmarkcr.com
O: 717-731-1990
cheller@landmarkcr.com

Nick Sallack
O: 717-731-1990
M: 717-829-4011
nsallack@landmarkcr.com
O: 717-731-1990
M: 717-829-4011
nsallack@landmarkcr.com
While we strive to provide the most accurate information, all listing information, and demographic data, is provided by third-parties. As such, MyEListing will not be responsible for the accuracy of the information. It is strongly recommended that you verify all information with the listing agent, and any relevant agencies, prior to making any decisions.