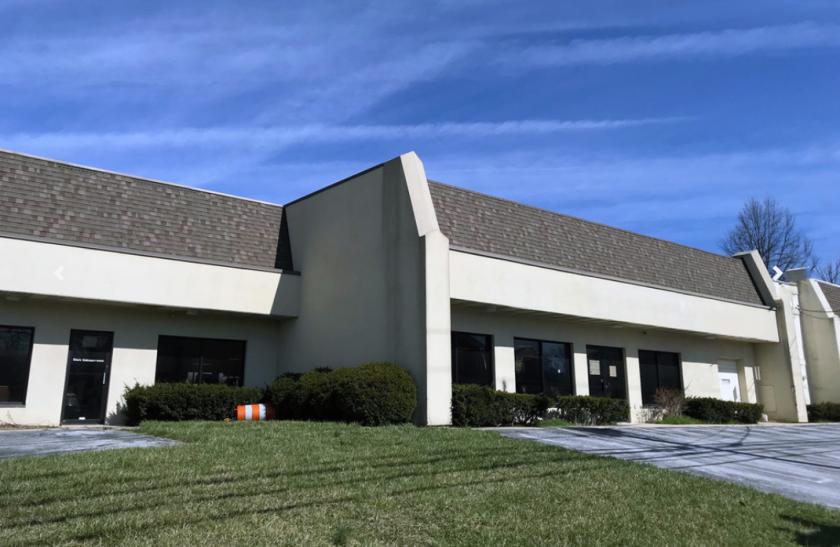
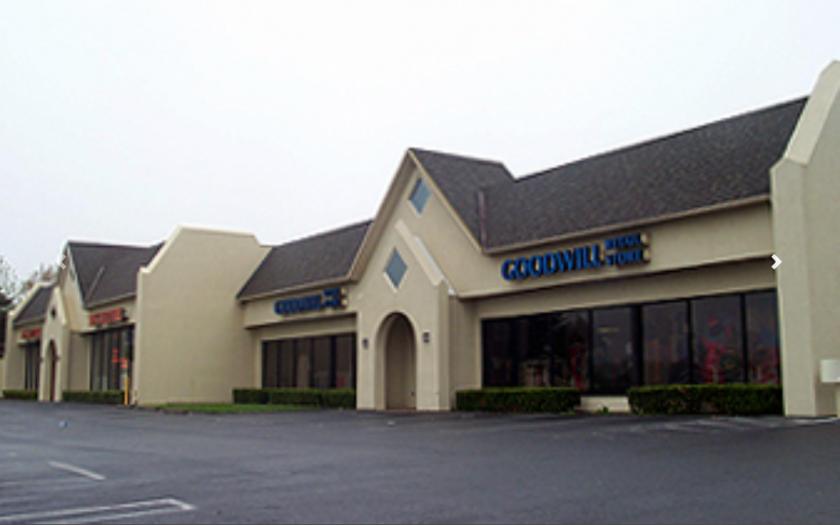
1-Mile | 3-Miles | 5-Miles | ||
---|---|---|---|---|
Total Population | 6,226 | 52,189 | 122,048 | |
Population Median Age | 40 | 40 | 39 | |
Population by Age | 0-9 Yrs | 635 (10%) | 5962 (11%) | 15239 (12%) |
10-19 Yrs | 744 (11%) | 5884 (11%) | 14806 (12%) | |
20-29 Yrs | 1053 (16%) | 6998 (13%) | 16212 (13%) | |
30-39 Yrs | 888 (14%) | 6989 (13%) | 15707 (12%) | |
40-49 Yrs | 670 (10%) | 6561 (12%) | 15284 (12%) | |
50-59 Yrs | 779 (12%) | 7040 (13%) | 16334 (13%) | |
60-69 Yrs | 767 (12%) | 6805 (13%) | 15966 (13%) | |
70+ Yrs | 690 (11%) | 5950 (11%) | 12501 (10%) | |
Median HH Income | $72,939 | $68,639 | $64,274 | |
Total Household Income | < 24K | 223 (9%) | 3069 (13%) | 7958 (16%) |
25-49K | 584 (23%) | 4846 (21%) | 10891 (21%) | |
50-74K | 457 (18%) | 4040 (18%) | 9813 (19%) | |
75-99K | 365 (14%) | 3224 (14%) | 7287 (14%) | |
100-199K | 677 (27%) | 5633 (25%) | 11289 (22%) | |
200K+ | 166 (6%) | 1265 (5%) | 2490 (5%) | |
Highest Education Level | No Diploma | 236 | 2299 | 7217 |
Diploma or GED | 1695 | 11600 | 27410 | |
Some College | 694 | 6302 | 14422 | |
Assoc. Degree | 328 | 3494 | 7954 | |
Bachelors Degree | 880 | 8500 | 17507 | |
Higher Degree | 482 | 4853 | 10112 | |
Total Housing Units | 2,575 | 23,234 | 53,619 | |
--Owner-Occupied | 1,823 | 14,516 | 31,774 | |
--Renter-Occupied | 648 | 7,561 | 17,955 | |
Owner-Occupied Values | < 100K | 63 | 746 | 4046 |
100-199K | 1142 | 7575 | 15386 | |
200-299K | 562 | 3886 | 7407 | |
300-399K | 25 | 1396 | 3112 | |
400-499K | 20 | 410 | 802 | |
500K+ | 12 | 503 | 1020 | |
Total Working Age Population | 5,094 | 42,708 | 97,336 | |
In Work Force | 3,359 | 28,917 | 64,790 | |
Not In Work Force | 1,736 | 13,791 | 32,547 | |
Workforce Employed | 3,268 | 27,624 | 61,504 | |
Workforce Unemployed | 77 | 1,227 | 3,142 | |
Civlian Workforce | 3,346 | 28,851 | 64,646 | |
Military Workforce | 13 | 66 | 144 | |
Total Households | 2,471 | 22,077 | 49,728 | |
Family Households | 1,616 | 13,681 | 31,464 | |
Non-Family Households | 855 | 8,396 | 18,264 | |
Married Couple | 1,223 | 10,266 | 21,808 | |
Other Family | 393 | 3,414 | 9,656 | |
Married w/Child | 525 | 3,959 | 7,973 | |
Single Male w/Child | 14 | 442 | 1,286 | |
Single Female w/Child | 107 | 1,157 | 3,814 |
Population Change Last Two Decades - Plus Projection
2000 | % | 2010 | % | 2020 | % | 2030 | |
---|---|---|---|---|---|---|---|
Pennsylvania | 12,281,054 | +3 | 12,702,379 | +4 | 13,230,170 | +4 | 13,759,594 |
Cumberland County | 213,674 | +10 | 235,406 | +7 | 251,836 | +6 | 268,063 |
Dauphin County | 251,798 | +6 | 268,100 | +4 | 279,506 | +3 | 289,132 |
Lancaster County | 470,658 | +10 | 519,445 | +8 | 559,247 | +8 | 602,153 |
Total Working Age Population:
Total Households:
Total Working Age Population:
Total Households:
Total Working Age Population:
Total Households: