Industrial Properties
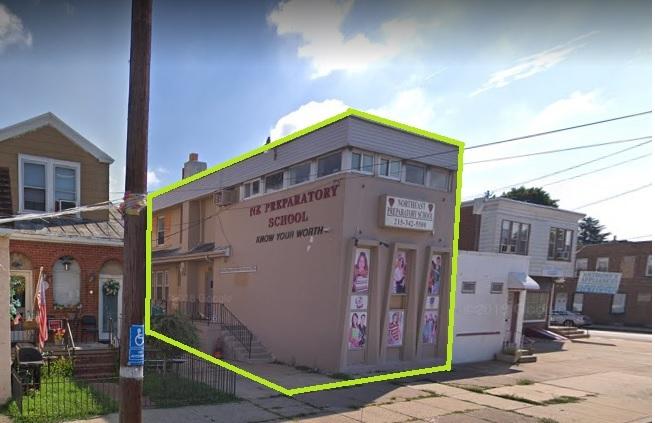
1309 Cottman Avenue Philadelphia, PA 19111
1309 Cottman Avenue Philadelphia, PA 19111
Details & Description
Property Highlights
- • CMX- 2 Zoning
- • Recently Rehabbed
- • Proximity to Pubic Transportation - Septa Bus Stop
- • Major Commercial Artery
Listing Agents

Devan Roberts
KW Commercial
O: 267-539-1944
M: 267-539-1944
devangroberts@gmail.com
KW Commercial
O: 267-539-1944
M: 267-539-1944
devangroberts@gmail.com
While we strive to provide the most accurate information, all listing information, and demographic data, is provided by third-parties. As such, MyEListing will not be responsible for the accuracy of the information. It is strongly recommended that you verify all information with the listing agent, and any relevant agencies, prior to making any decisions.


