Retail Space
257 Pompton Avenue Verona, NJ 07044
257 Pompton Avenue Verona, NJ 07044
Details & Description
Property Highlights
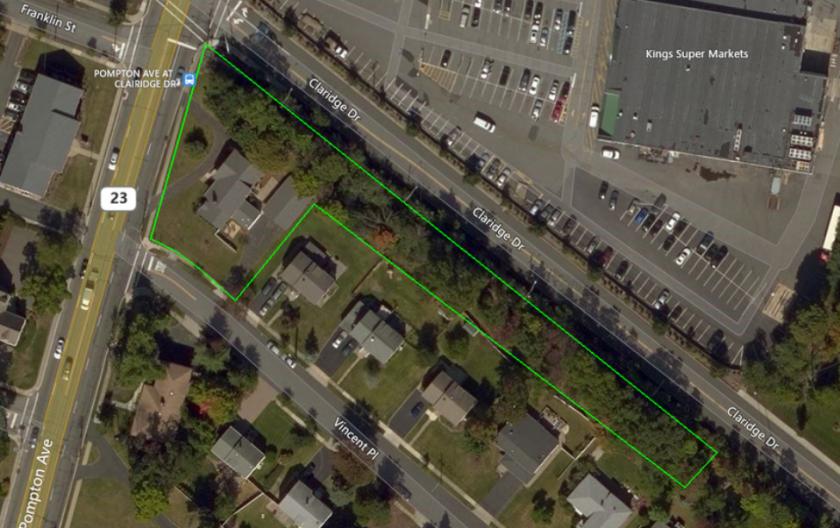
- • 0.77-AC Lot Block 104, Lot 1
- • Ideal for Day Care, School or Professional Office
- • C2 Professional Office and Business Zone
- • At Corner of Pompton Avenue and Claridge Drive
Listing Agents

Frank Bruno
O: 973-379-6644
M: 718-887-1570
fbruno@blauberg.com
O: 973-379-6644
M: 718-887-1570
fbruno@blauberg.com
While we strive to provide the most accurate information, all listing information, and demographic data, is provided by third-parties. As such, MyEListing will not be responsible for the accuracy of the information. It is strongly recommended that you verify all information with the listing agent, and any relevant agencies, prior to making any decisions.