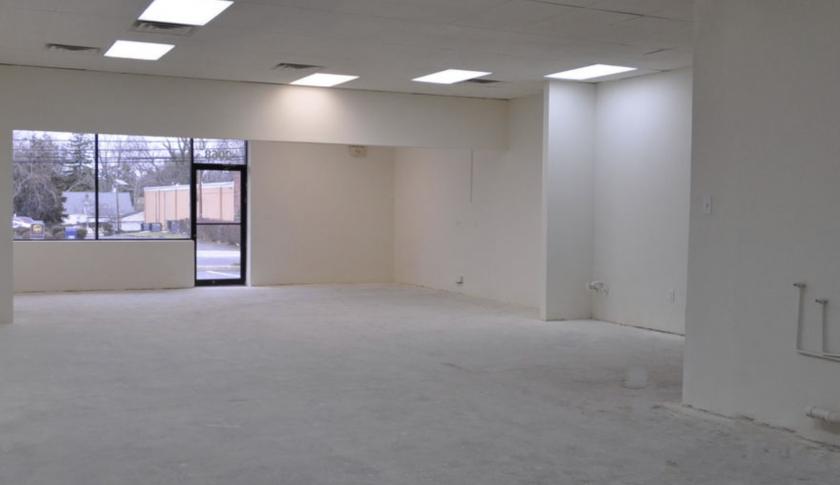
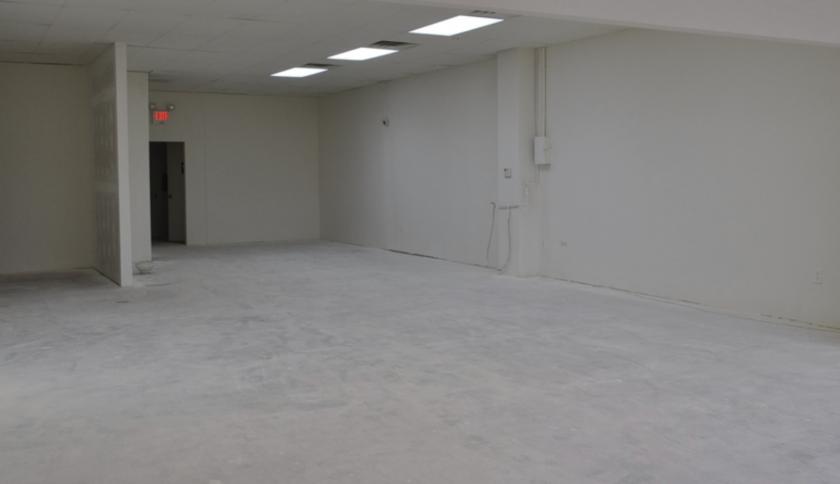
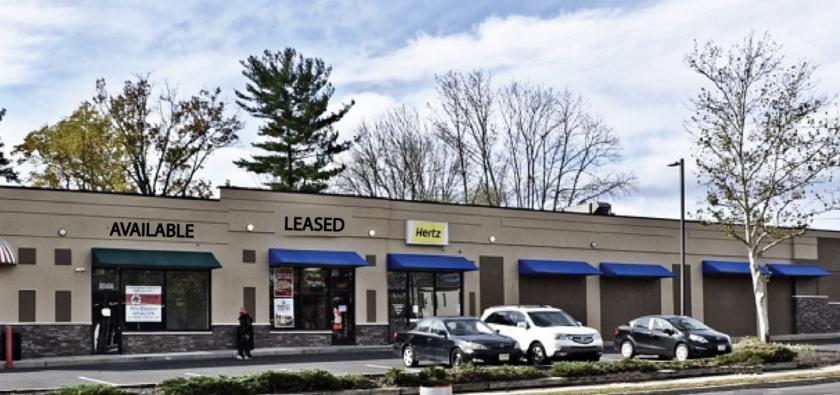
1-Mile | 3-Miles | 5-Miles | ||
---|---|---|---|---|
Total Population | 14,215 | 147,448 | 251,089 | |
Population Median Age | 38 | 36 | 38 | |
Population by Age | 0-9 Yrs | 1620 (11%) | 19518 (13%) | 29644 (11%) |
10-19 Yrs | 1710 (12%) | 20662 (14%) | 32964 (13%) | |
20-29 Yrs | 2108 (14%) | 23978 (16%) | 36959 (14%) | |
30-39 Yrs | 2390 (16%) | 19786 (13%) | 33911 (13%) | |
40-49 Yrs | 1832 (12%) | 18380 (12%) | 31637 (12%) | |
50-59 Yrs | 1882 (13%) | 18985 (12%) | 34746 (13%) | |
60-69 Yrs | 1507 (10%) | 14254 (9%) | 27930 (11%) | |
70+ Yrs | 1165 (8%) | 11884 (8%) | 23297 (9%) | |
Median HH Income | $51,648 | $52,206 | $66,062 | |
Total Household Income | < 24K | 1262 (25%) | 13771 (27%) | 18885 (20%) |
25-49K | 1129 (22%) | 10398 (20%) | 16684 (18%) | |
50-74K | 1044 (21%) | 8404 (16%) | 14872 (16%) | |
75-99K | 475 (9%) | 5502 (11%) | 11285 (12%) | |
100-199K | 849 (17%) | 9814 (19%) | 21728 (24%) | |
200K+ | 189 (3%) | 2043 (4%) | 6745 (7%) | |
Highest Education Level | No Diploma | 2138 | 18728 | 24489 |
Diploma or GED | 3437 | 31653 | 50295 | |
Some College | 1785 | 18576 | 31377 | |
Assoc. Degree | 468 | 5303 | 10488 | |
Bachelors Degree | 1036 | 11485 | 29906 | |
Higher Degree | 892 | 7948 | 22193 | |
Total Housing Units | 5,681 | 58,891 | 102,370 | |
--Owner-Occupied | 2,623 | 24,325 | 51,995 | |
--Renter-Occupied | 2,325 | 25,606 | 38,204 | |
Owner-Occupied Values | < 100K | 833 | 6087 | 7376 |
100-199K | 937 | 8239 | 14085 | |
200-299K | 596 | 5949 | 14377 | |
300-399K | 204 | 2789 | 8589 | |
400-499K | 42 | 645 | 4054 | |
500K+ | 11 | 617 | 3513 | |
Total Working Age Population | 11,398 | 117,766 | 203,468 | |
In Work Force | 7,079 | 72,608 | 130,535 | |
Not In Work Force | 4,319 | 45,158 | 72,933 | |
Workforce Employed | 6,464 | 65,926 | 120,939 | |
Workforce Unemployed | 611 | 6,593 | 9,454 | |
Civlian Workforce | 7,075 | 72,519 | 130,393 | |
Military Workforce | 4 | 89 | 142 | |
Total Households | 4,948 | 49,932 | 90,200 | |
Family Households | 2,964 | 30,472 | 56,841 | |
Non-Family Households | 1,983 | 19,459 | 33,359 | |
Married Couple | 1,695 | 17,378 | 37,261 | |
Other Family | 1,269 | 13,094 | 19,579 | |
Married w/Child | 655 | 7,039 | 14,705 | |
Single Male w/Child | 145 | 892 | 1,685 | |
Single Female w/Child | 475 | 5,604 | 7,621 |
Population Change Last Two Decades - Plus Projection
2000 | % | 2010 | % | 2020 | % | 2030 | |
---|---|---|---|---|---|---|---|
New Jersey | 8,414,350 | +4 | 8,791,894 | +4 | 9,132,700 | +4 | 9,530,900 |
Burlington County | 423,394 | +6 | 448,734 | 0 | 450,000 | +3 | 464,900 |
Mercer County | 350,761 | +4 | 366,513 | +3 | 379,000 | +5 | 397,400 |
Pennsylvania | 12,281,054 | +3 | 12,702,379 | +4 | 13,230,170 | +4 | 13,759,594 |
Bucks County | 597,635 | +5 | 625,249 | +1 | 629,420 | +1 | 637,730 |
Total Working Age Population:
Total Households:
Total Working Age Population:
Total Households:
Total Working Age Population:
Total Households: