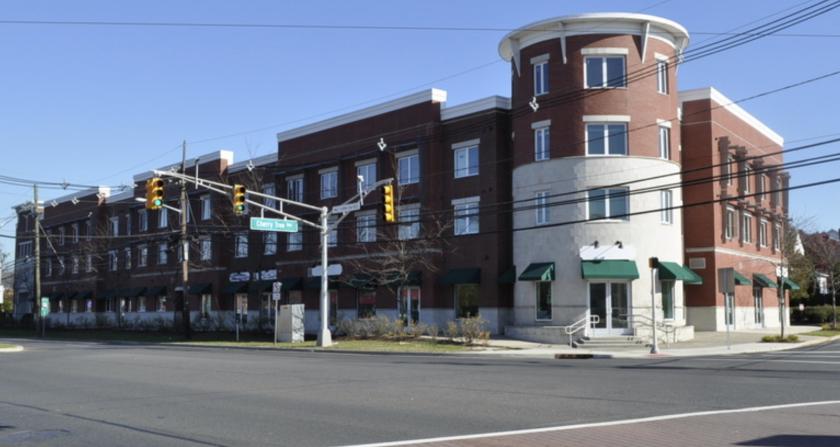
1-Mile | 3-Miles | 5-Miles | ||
---|---|---|---|---|
Total Population | 10,697 | 124,267 | 250,986 | |
Population Median Age | 39 | 37 | 38 | |
Population by Age | 0-9 Yrs | 1205 (11%) | 15885 (12%) | 29758 (11%) |
10-19 Yrs | 1279 (11%) | 17651 (14%) | 32912 (13%) | |
20-29 Yrs | 1411 (13%) | 20122 (16%) | 37179 (14%) | |
30-39 Yrs | 1693 (15%) | 16355 (13%) | 34082 (13%) | |
40-49 Yrs | 1571 (14%) | 15514 (12%) | 31866 (12%) | |
50-59 Yrs | 1420 (13%) | 15869 (12%) | 34522 (13%) | |
60-69 Yrs | 1149 (10%) | 12129 (9%) | 27404 (10%) | |
70+ Yrs | 968 (9%) | 10741 (8%) | 23262 (9%) | |
Median HH Income | $69,226 | $55,845 | $66,674 | |
Total Household Income | < 24K | 615 (16%) | 10795 (25%) | 18738 (20%) |
25-49K | 733 (19%) | 8621 (20%) | 16382 (18%) | |
50-74K | 680 (18%) | 7365 (17%) | 14642 (16%) | |
75-99K | 456 (12%) | 4758 (11%) | 11275 (12%) | |
100-199K | 982 (26%) | 8936 (21%) | 21715 (24%) | |
200K+ | 264 (7%) | 2063 (4%) | 6856 (7%) | |
Highest Education Level | No Diploma | 1204 | 14616 | 24574 |
Diploma or GED | 2282 | 26472 | 50056 | |
Some College | 1275 | 15289 | 31375 | |
Assoc. Degree | 427 | 4770 | 10396 | |
Bachelors Degree | 1090 | 10382 | 30138 | |
Higher Degree | 1103 | 7525 | 21988 | |
Total Housing Units | 4,086 | 49,581 | 101,712 | |
--Owner-Occupied | 2,222 | 21,768 | 51,599 | |
--Renter-Occupied | 1,510 | 20,770 | 38,008 | |
Owner-Occupied Values | < 100K | 334 | 4789 | 7314 |
100-199K | 528 | 6736 | 14058 | |
200-299K | 759 | 5808 | 14688 | |
300-399K | 490 | 3093 | 8339 | |
400-499K | 66 | 754 | 3594 | |
500K+ | 46 | 589 | 3605 | |
Total Working Age Population | 8,602 | 99,985 | 203,255 | |
In Work Force | 5,483 | 62,874 | 130,600 | |
Not In Work Force | 3,119 | 37,111 | 72,655 | |
Workforce Employed | 5,135 | 57,069 | 121,055 | |
Workforce Unemployed | 344 | 5,716 | 9,408 | |
Civlian Workforce | 5,479 | 62,785 | 130,463 | |
Military Workforce | 4 | 89 | 137 | |
Total Households | 3,731 | 42,538 | 89,607 | |
Family Households | 2,463 | 26,241 | 56,790 | |
Non-Family Households | 1,268 | 16,297 | 32,818 | |
Married Couple | 1,728 | 15,741 | 37,385 | |
Other Family | 736 | 10,500 | 19,404 | |
Married w/Child | 680 | 6,315 | 14,932 | |
Single Male w/Child | 115 | 760 | 1,612 | |
Single Female w/Child | 282 | 4,304 | 7,505 |
Population Change Last Two Decades - Plus Projection
2000 | % | 2010 | % | 2020 | % | 2030 | |
---|---|---|---|---|---|---|---|
New Jersey | 8,414,350 | +4 | 8,791,894 | +4 | 9,132,700 | +4 | 9,530,900 |
Burlington County | 423,394 | +6 | 448,734 | 0 | 450,000 | +3 | 464,900 |
Mercer County | 350,761 | +4 | 366,513 | +3 | 379,000 | +5 | 397,400 |
Pennsylvania | 12,281,054 | +3 | 12,702,379 | +4 | 13,230,170 | +4 | 13,759,594 |
Bucks County | 597,635 | +5 | 625,249 | +1 | 629,420 | +1 | 637,730 |
Total Working Age Population:
Total Households:
Total Working Age Population:
Total Households:
Total Working Age Population:
Total Households: