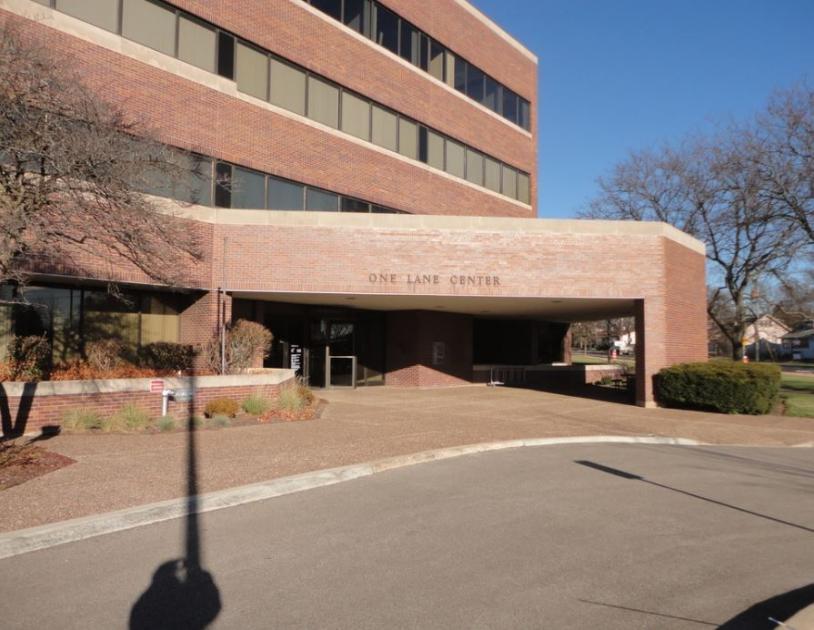
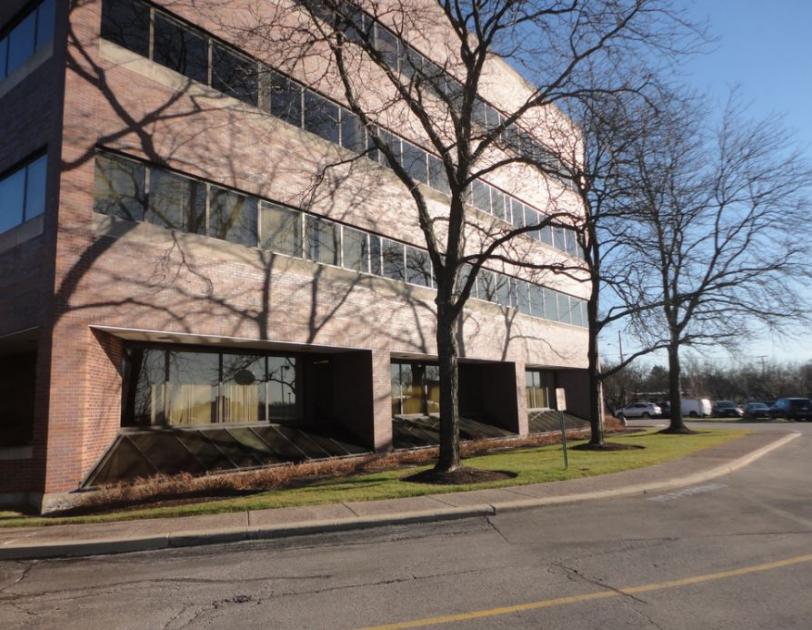
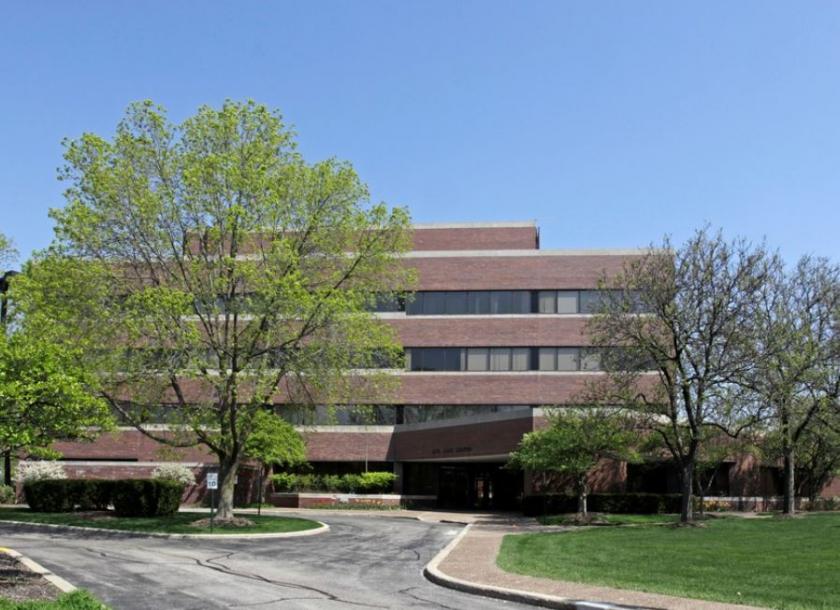
1-Mile | 3-Miles | 5-Miles | ||
---|---|---|---|---|
Total Population | 7,650 | 69,045 | 194,370 | |
Population Median Age | 41 | 45 | 42 | |
Population by Age | 0-9 Yrs | 954 (12%) | 7771 (11%) | 24239 (12%) |
10-19 Yrs | 1320 (17%) | 9598 (13%) | 27246 (14%) | |
20-29 Yrs | 438 (5%) | 3317 (4%) | 12762 (6%) | |
30-39 Yrs | 658 (8%) | 5988 (8%) | 19705 (10%) | |
40-49 Yrs | 1110 (14%) | 9515 (13%) | 26492 (13%) | |
50-59 Yrs | 1260 (16%) | 10504 (15%) | 28922 (14%) | |
60-69 Yrs | 956 (12%) | 9685 (14%) | 25915 (13%) | |
70+ Yrs | 953 (12%) | 12667 (18%) | 29089 (14%) | |
Median HH Income | $120,814 | $130,941 | $120,316 | |
Total Household Income | < 24K | 174 (6%) | 2240 (8%) | 7321 (10%) |
25-49K | 415 (14%) | 2880 (10%) | 8884 (12%) | |
50-74K | 280 (9%) | 2818 (10%) | 8449 (11%) | |
75-99K | 259 (9%) | 2310 (8%) | 6488 (8%) | |
100-199K | 833 (29%) | 8444 (31%) | 20108 (27%) | |
200K+ | 848 (30%) | 8320 (30%) | 21624 (29%) | |
Highest Education Level | No Diploma | 94 | 925 | 6097 |
Diploma or GED | 406 | 4706 | 15764 | |
Some College | 619 | 6058 | 16917 | |
Assoc. Degree | 165 | 1652 | 5612 | |
Bachelors Degree | 2102 | 18337 | 46462 | |
Higher Degree | 1760 | 17946 | 45118 | |
Total Housing Units | 3,035 | 29,081 | 77,934 | |
--Owner-Occupied | 2,358 | 22,981 | 58,175 | |
--Renter-Occupied | 451 | 4,031 | 14,698 | |
Owner-Occupied Values | < 100K | 29 | 368 | 1600 |
100-199K | 71 | 1032 | 4448 | |
200-299K | 107 | 1728 | 5598 | |
300-399K | 457 | 2958 | 7361 | |
400-499K | 376 | 4073 | 7959 | |
500K+ | 1318 | 12822 | 31209 | |
Total Working Age Population | 5,810 | 54,959 | 152,736 | |
In Work Force | 3,742 | 32,699 | 94,796 | |
Not In Work Force | 2,067 | 22,260 | 57,941 | |
Workforce Employed | 3,617 | 31,681 | 91,704 | |
Workforce Unemployed | 125 | 1,009 | 3,022 | |
Civlian Workforce | 3,742 | 32,690 | 94,726 | |
Military Workforce | 0 | 10 | 69 | |
Total Households | 2,809 | 27,012 | 72,872 | |
Family Households | 2,205 | 19,893 | 53,580 | |
Non-Family Households | 604 | 7,119 | 19,293 | |
Married Couple | 1,930 | 17,914 | 46,757 | |
Other Family | 275 | 1,979 | 6,822 | |
Married w/Child | 884 | 7,289 | 20,454 | |
Single Male w/Child | 19 | 129 | 798 | |
Single Female w/Child | 161 | 867 | 2,525 |
Population Change Last Two Decades - Plus Projection
2000 | % | 2010 | % | 2020 | % | 2030 | |
---|---|---|---|---|---|---|---|
Illinois | 12,419,293 | +3 | 12,830,632 | +12 | 14,316,487 | +6 | 15,138,849 |
Cook County | 5,376,741 | -3 | 5,194,675 | +10 | 5,707,832 | +5 | 5,990,243 |
Lake County | 644,356 | +9 | 703,462 | +17 | 820,250 | +6 | 873,024 |
Total Working Age Population:
Total Households:
Total Working Age Population:
Total Households:
Total Working Age Population:
Total Households: