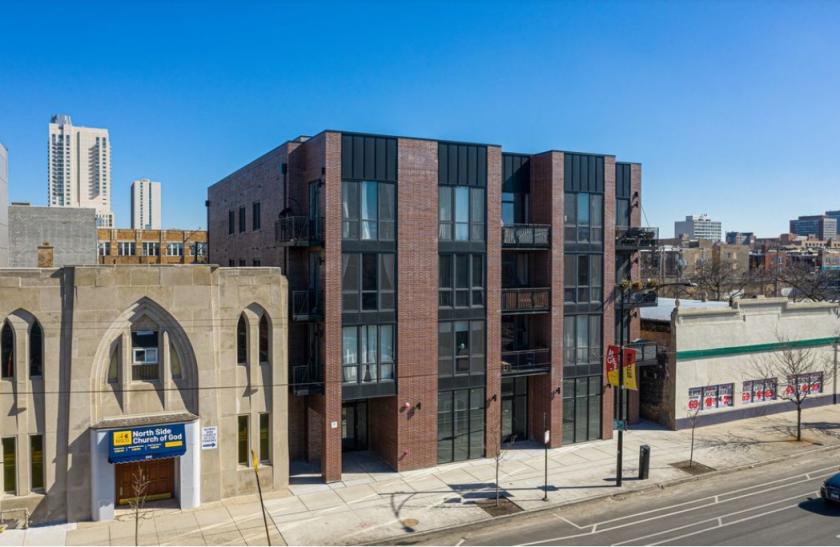
Multifamily Housing
5139 North Broadway Chicago, IL 60640
5139 North Broadway Chicago, IL 60640
Details & Description
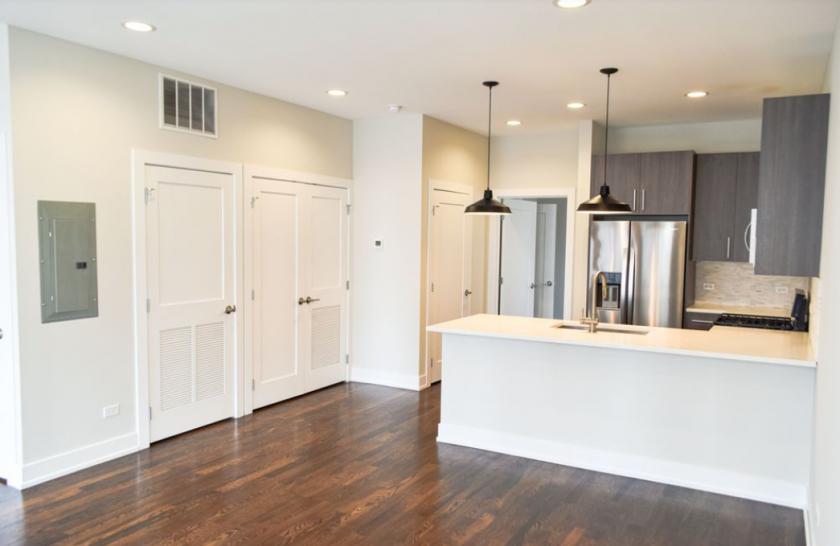
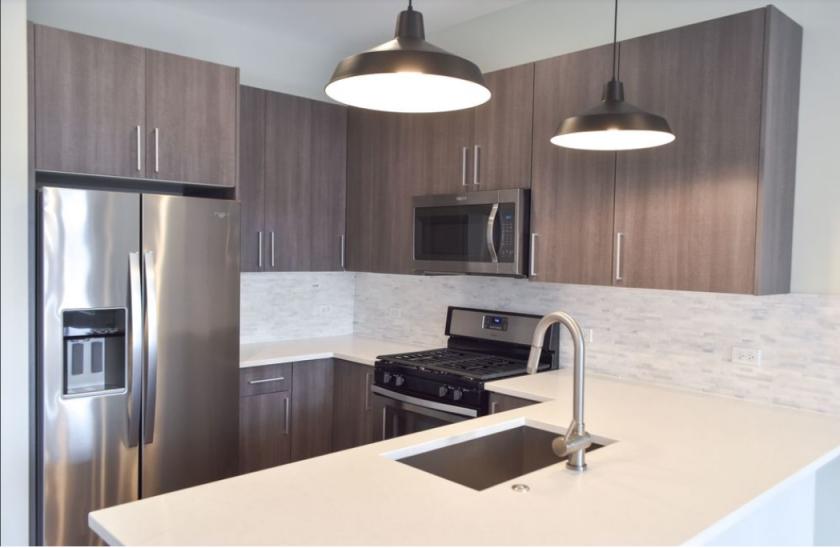
Property Highlights
- • High-End Luxury Condo Quality
- • Heated Garage Parking
- • 2 Blocks from Red Line Stations
Listing Agents

Rick Ofman
O: 773-305-4900
rick@essexrealtygroup.com
O: 773-305-4900
rick@essexrealtygroup.com
While we strive to provide the most accurate information, all listing information, and demographic data, is provided by third-parties. As such, MyEListing will not be responsible for the accuracy of the information. It is strongly recommended that you verify all information with the listing agent, and any relevant agencies, prior to making any decisions.