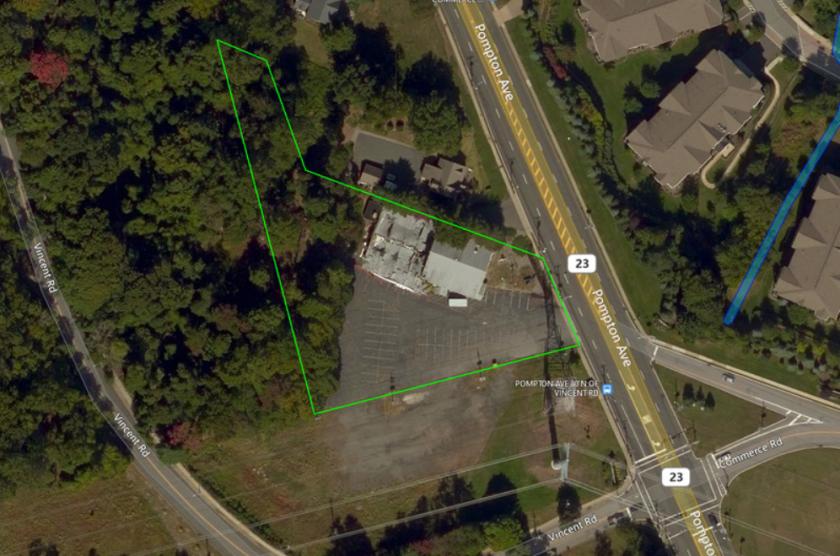
1-Mile | 3-Miles | 5-Miles | ||
---|---|---|---|---|
Total Population | 9,544 | 96,253 | 341,057 | |
Population Median Age | 44 | 42 | 40 | |
Population by Age | 0-9 Yrs | 952 (9%) | 10521 (10%) | 40561 (11%) |
10-19 Yrs | 1006 (10%) | 11863 (12%) | 42224 (12%) | |
20-29 Yrs | 900 (9%) | 10369 (10%) | 40685 (11%) | |
30-39 Yrs | 1110 (11%) | 10262 (10%) | 42384 (12%) | |
40-49 Yrs | 1217 (12%) | 13448 (13%) | 46460 (13%) | |
50-59 Yrs | 1479 (15%) | 14680 (15%) | 48534 (14%) | |
60-69 Yrs | 1247 (13%) | 12231 (12%) | 40304 (11%) | |
70+ Yrs | 1634 (17%) | 12878 (13%) | 39905 (11%) | |
Median HH Income | $127,567 | $117,714 | $92,385 | |
Total Household Income | < 24K | 202 (6%) | 2865 (8%) | 17160 (14%) |
25-49K | 343 (10%) | 3977 (11%) | 17573 (14%) | |
50-74K | 330 (9%) | 4126 (11%) | 15514 (12%) | |
75-99K | 362 (10%) | 3835 (11%) | 14012 (11%) | |
100-199K | 1206 (36%) | 11456 (32%) | 34900 (29%) | |
200K+ | 871 (26%) | 8580 (24%) | 20825 (17%) | |
Highest Education Level | No Diploma | 342 | 3557 | 24431 |
Diploma or GED | 1717 | 14208 | 61991 | |
Some College | 1079 | 9593 | 35449 | |
Assoc. Degree | 393 | 3333 | 12151 | |
Bachelors Degree | 2167 | 22622 | 63798 | |
Higher Degree | 1342 | 14845 | 40208 | |
Total Housing Units | 3,395 | 36,134 | 126,955 | |
--Owner-Occupied | 2,819 | 26,906 | 76,837 | |
--Renter-Occupied | 493 | 7,933 | 43,147 | |
Owner-Occupied Values | < 100K | 18 | 276 | 1267 |
100-199K | 33 | 1019 | 3850 | |
200-299K | 76 | 2840 | 11587 | |
300-399K | 653 | 5636 | 21497 | |
400-499K | 752 | 5784 | 14937 | |
500K+ | 1288 | 11351 | 23699 | |
Total Working Age Population | 7,956 | 78,541 | 274,398 | |
In Work Force | 5,135 | 52,699 | 179,572 | |
Not In Work Force | 2,822 | 25,842 | 94,826 | |
Workforce Employed | 5,017 | 50,773 | 172,630 | |
Workforce Unemployed | 117 | 1,926 | 6,941 | |
Civlian Workforce | 5,135 | 52,699 | 179,571 | |
Military Workforce | 0 | 0 | 1 | |
Total Households | 3,313 | 34,840 | 119,984 | |
Family Households | 2,678 | 24,818 | 84,310 | |
Non-Family Households | 635 | 10,022 | 35,674 | |
Married Couple | 2,306 | 21,065 | 63,470 | |
Other Family | 373 | 3,753 | 20,840 | |
Married w/Child | 952 | 8,928 | 28,227 | |
Single Male w/Child | 7 | 402 | 2,310 | |
Single Female w/Child | 68 | 838 | 6,348 |
Population Change Last Two Decades - Plus Projection
2000 | % | 2010 | % | 2020 | % | 2030 | |
---|---|---|---|---|---|---|---|
New Jersey | 8,414,350 | +4 | 8,791,894 | +4 | 9,132,700 | +4 | 9,530,900 |
Bergen County | 884,118 | +2 | 905,116 | +7 | 967,500 | +7 | 1,031,500 |
Essex County | 793,633 | -1 | 783,969 | +3 | 808,300 | +3 | 829,800 |
Hudson County | 608,975 | +4 | 634,266 | +12 | 708,100 | +6 | 747,400 |
Morris County | 470,212 | +5 | 492,276 | +3 | 509,100 | +5 | 535,600 |
Passaic County | 489,049 | +2 | 501,226 | +4 | 521,700 | +3 | 536,100 |
Total Working Age Population:
Total Households:
Total Working Age Population:
Total Households:
Total Working Age Population:
Total Households: