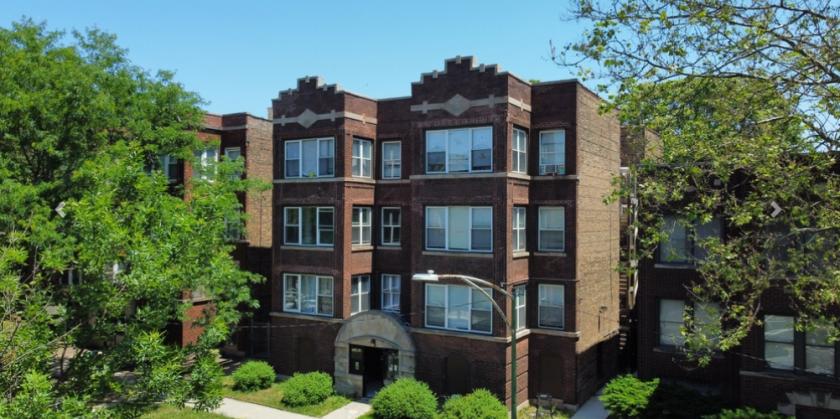
Multifamily Housing
7133 South East End Avenue Chicago, IL 60649
7133 South East End Avenue Chicago, IL 60649
Details & Description
Property Highlights
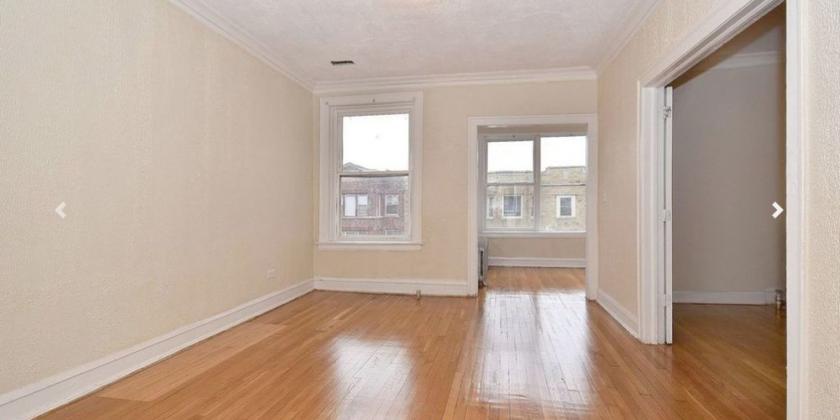
- • All 3Bd1Ba Units
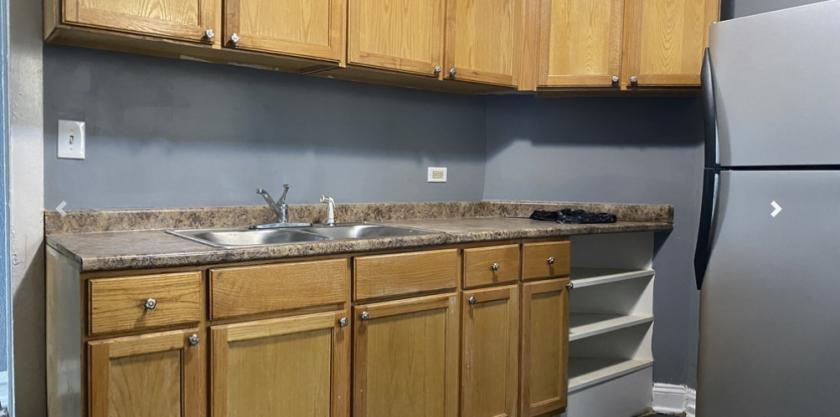
- • Updated Kitchens Baths
- • New Individual Furnaces
- • 13.18 Pro Forma Cap Rate
Listing Agents

Noah Birk
O: 773-293-5090
M: 630-209-3622
nbirk@kisergroup.com
O: 773-293-5090
M: 630-209-3622
nbirk@kisergroup.com

Aaron Sklar
O: 773-293-5032
asklar@kisergroup.com
O: 773-293-5032
asklar@kisergroup.com
While we strive to provide the most accurate information, all listing information, and demographic data, is provided by third-parties. As such, MyEListing will not be responsible for the accuracy of the information. It is strongly recommended that you verify all information with the listing agent, and any relevant agencies, prior to making any decisions.