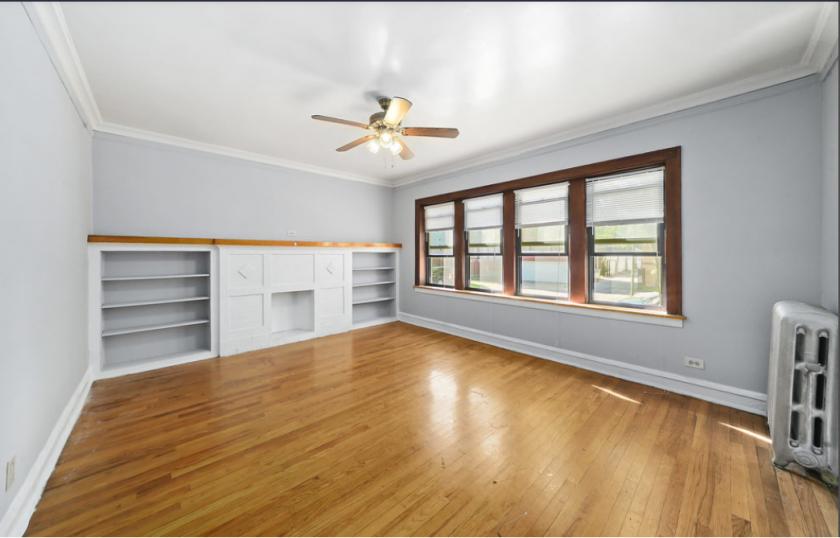
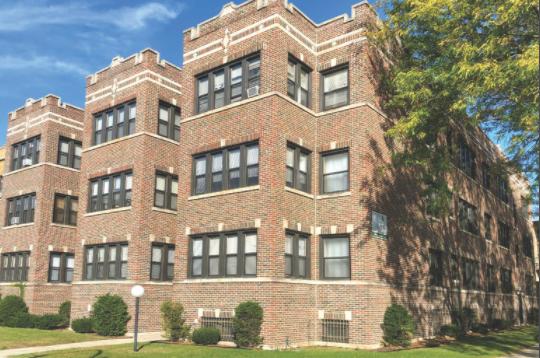
1-Mile | 3-Miles | 5-Miles | ||
---|---|---|---|---|
Total Population | 36,603 | 278,763 | 622,285 | |
Population Median Age | 41 | 39 | 38 | |
Population by Age | 0-9 Yrs | 4179 (11%) | 33787 (12%) | 75206 (12%) |
10-19 Yrs | 3821 (10%) | 37062 (13%) | 80009 (12%) | |
20-29 Yrs | 5500 (15%) | 41227 (14%) | 99137 (15%) | |
30-39 Yrs | 4525 (12%) | 33639 (12%) | 79930 (12%) | |
40-49 Yrs | 4019 (10%) | 33113 (11%) | 73395 (11%) | |
50-59 Yrs | 5343 (14%) | 37962 (13%) | 79247 (12%) | |
60-69 Yrs | 4963 (13%) | 31205 (11%) | 68988 (11%) | |
70+ Yrs | 4253 (11%) | 30767 (11%) | 66373 (10%) | |
Median HH Income | $32,950 | $33,331 | $38,159 | |
Total Household Income | < 24K | 6817 (41%) | 46460 (40%) | 92356 (36%) |
25-49K | 3781 (22%) | 27365 (24%) | 58439 (23%) | |
50-74K | 2529 (15%) | 16053 (14%) | 37199 (14%) | |
75-99K | 1621 (9%) | 10303 (9%) | 23948 (9%) | |
100-199K | 1577 (9%) | 11889 (10%) | 33955 (13%) | |
200K+ | 222 (1%) | 1933 (1%) | 7599 (2%) | |
Highest Education Level | No Diploma | 3249 | 24399 | 57171 |
Diploma or GED | 6988 | 52155 | 113598 | |
Some College | 8005 | 55779 | 102648 | |
Assoc. Degree | 1922 | 15173 | 30988 | |
Bachelors Degree | 3532 | 23858 | 60459 | |
Higher Degree | 2348 | 16560 | 53898 | |
Total Housing Units | 20,168 | 142,633 | 307,958 | |
--Owner-Occupied | 6,108 | 42,231 | 100,196 | |
--Renter-Occupied | 10,438 | 71,772 | 153,298 | |
Owner-Occupied Values | < 100K | 1128 | 10577 | 23559 |
100-199K | 3092 | 21295 | 46357 | |
200-299K | 1279 | 7193 | 16443 | |
300-399K | 421 | 1518 | 5926 | |
400-499K | 22 | 461 | 3110 | |
500K+ | 166 | 1186 | 4801 | |
Total Working Age Population | 29,980 | 223,350 | 500,691 | |
In Work Force | 17,779 | 128,476 | 297,749 | |
Not In Work Force | 12,202 | 94,874 | 202,942 | |
Workforce Employed | 14,570 | 106,438 | 251,277 | |
Workforce Unemployed | 3,209 | 22,016 | 46,225 | |
Civlian Workforce | 17,779 | 128,454 | 297,502 | |
Military Workforce | 0 | 22 | 247 | |
Total Households | 16,546 | 114,003 | 253,494 | |
Family Households | 7,467 | 58,732 | 130,645 | |
Non-Family Households | 9,079 | 55,271 | 122,850 | |
Married Couple | 2,192 | 18,540 | 52,507 | |
Other Family | 5,275 | 40,192 | 78,138 | |
Married w/Child | 669 | 6,254 | 19,385 | |
Single Male w/Child | 277 | 1,939 | 4,634 | |
Single Female w/Child | 2,032 | 15,821 | 29,280 |
Population Change Last Two Decades - Plus Projection
2000 | % | 2010 | % | 2020 | % | 2030 | |
---|---|---|---|---|---|---|---|
Illinois | 12,419,293 | +3 | 12,830,632 | +12 | 14,316,487 | +6 | 15,138,849 |
Cook County | 5,376,741 | -3 | 5,194,675 | +10 | 5,707,832 | +5 | 5,990,243 |
Will County | 502,266 | +35 | 677,560 | +34 | 907,625 | +20 | 1,093,207 |
Indiana | 6,080,485 | +7 | 6,483,802 | +4 | 6,738,573 | +4 | 7,014,880 |
Lake County | 484,564 | +2 | 496,005 | -3 | 479,815 | +1 | 482,321 |
Total Working Age Population:
Total Households:
Total Working Age Population:
Total Households:
Total Working Age Population:
Total Households: