Multifamily Housing
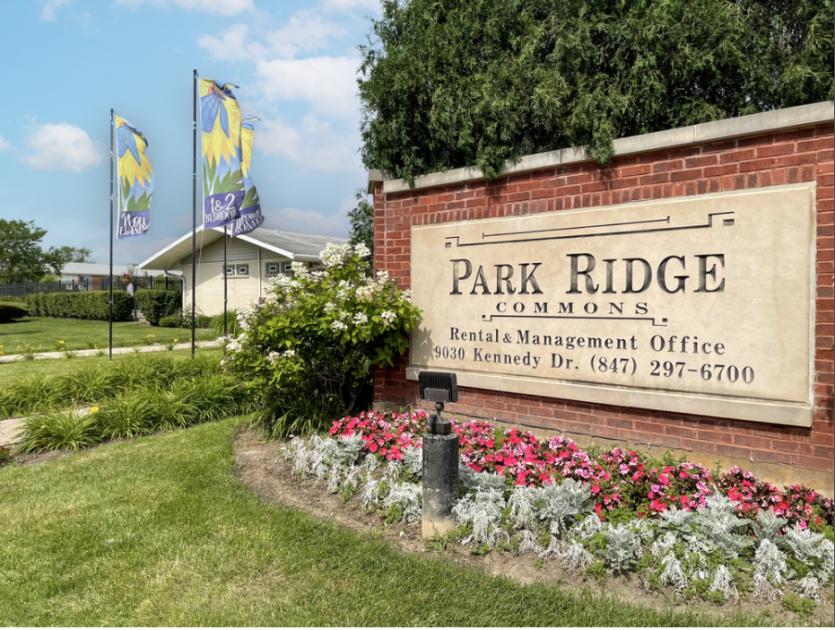
9020 Washington Drive Des Plaines, IL 60016
9020 Washington Drive Des Plaines, IL 60016
Details & Description
Property Highlights
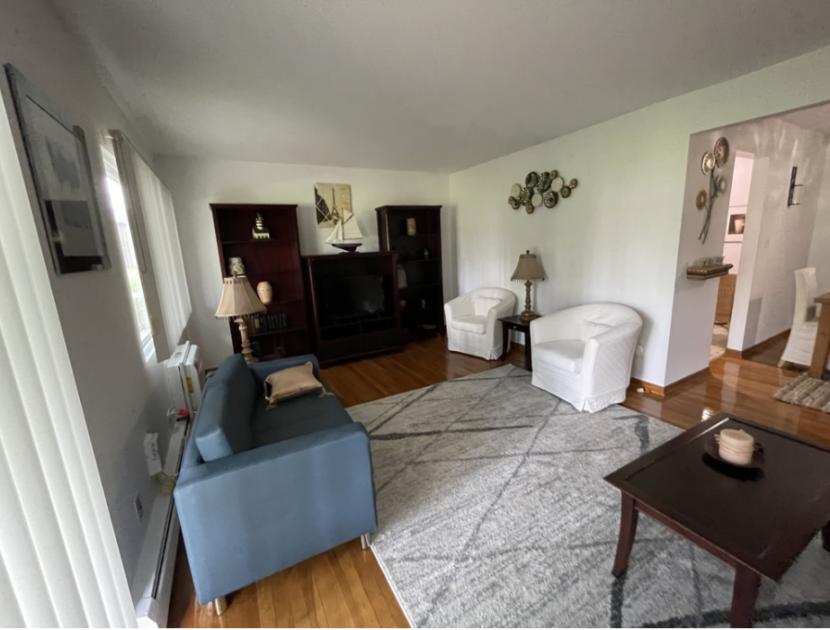
• Amenities Include Pool, Volleyball Courts, Fitness Center, Tennis Courts, and More
• Attractive Unit Mix of One and Two Bedroom Units in Walk Up Style Buildings
Listing Agents

Lee Kiser
O: 773-293-5000
lkiser@kisergroup.com
O: 773-293-5000
lkiser@kisergroup.com

Danny Mantis
O: 773-293-5095
dmantis@kisergroup.com
O: 773-293-5095
dmantis@kisergroup.com

Matt Halper
O: 773-293-5092
mhalper@kisergroup.com
O: 773-293-5092
mhalper@kisergroup.com
While we strive to provide the most accurate information, all listing information, and demographic data, is provided by third-parties. As such, MyEListing will not be responsible for the accuracy of the information. It is strongly recommended that you verify all information with the listing agent, and any relevant agencies, prior to making any decisions.