Industrial Properties
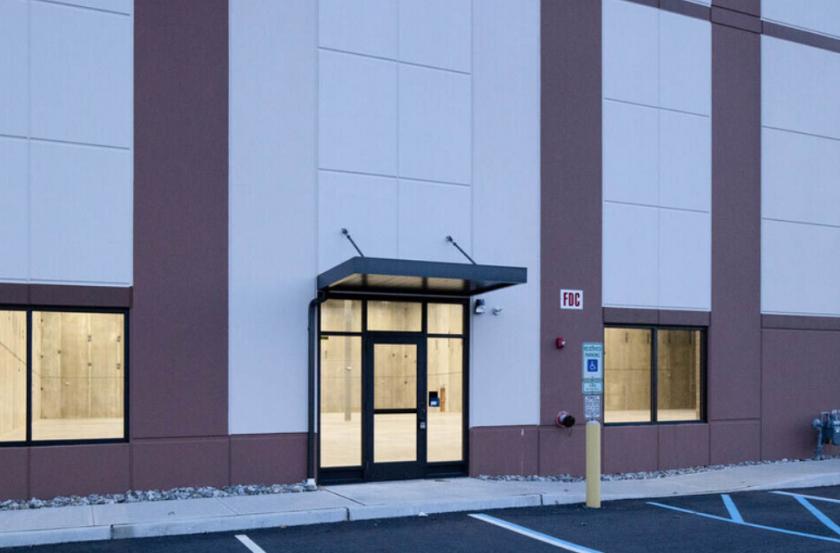
45 Jiffy Road Franklin Township, NJ 08873
45 Jiffy Road Franklin Township, NJ 08873

Details & Description
Property Highlights
- • Proposed Bldg 55,900 SF on 4 AC
- • Divisible By 31,225 SF 24,675 SF
- • Building Depth Varies 140 to 200
- • Building Width 350
- • Sprinkler ESFR
- • Column Spacing 575 x 50
Listing Agents

Jason M. Crimmins
O: 973-379-6644
M: 973-568-6611
jmcrimmins@blauberg.com
O: 973-379-6644
M: 973-568-6611
jmcrimmins@blauberg.com
While we strive to provide the most accurate information, all listing information, and demographic data, is provided by third-parties. As such, MyEListing will not be responsible for the accuracy of the information. It is strongly recommended that you verify all information with the listing agent, and any relevant agencies, prior to making any decisions.