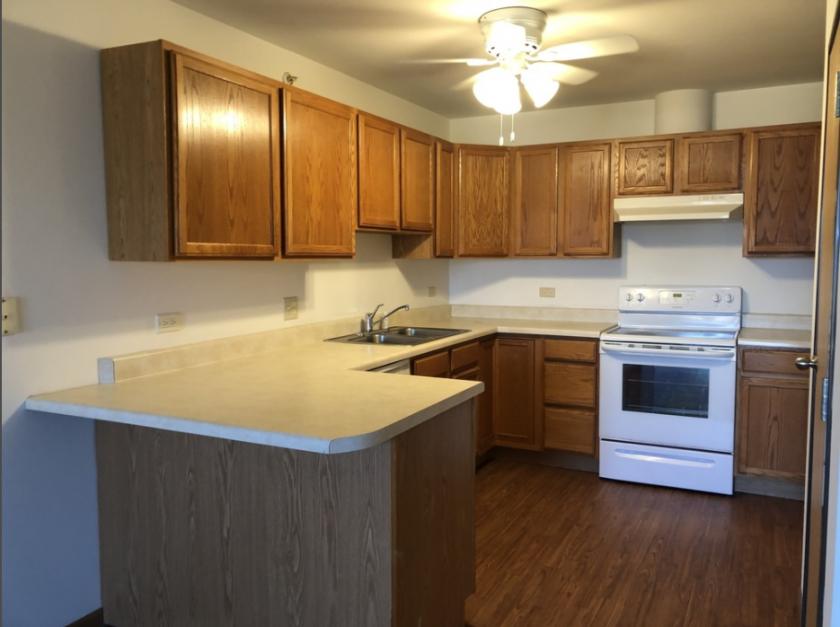
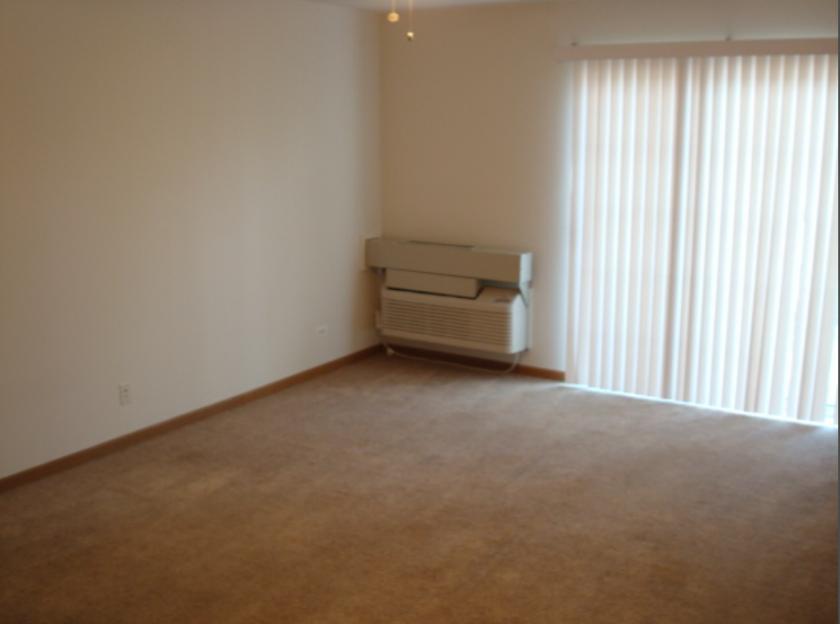
1-Mile | 3-Miles | 5-Miles | ||
---|---|---|---|---|
Total Population | 14,335 | 84,228 | 163,975 | |
Population Median Age | 34 | 35 | 34 | |
Population by Age | 0-9 Yrs | 2227 (15%) | 12324 (14%) | 24274 (14%) |
10-19 Yrs | 2422 (16%) | 13561 (16%) | 25931 (15%) | |
20-29 Yrs | 1933 (13%) | 12603 (14%) | 27841 (16%) | |
30-39 Yrs | 2015 (14%) | 11689 (13%) | 21268 (12%) | |
40-49 Yrs | 1828 (12%) | 11340 (13%) | 20544 (12%) | |
50-59 Yrs | 1825 (12%) | 9867 (11%) | 19059 (11%) | |
60-69 Yrs | 1111 (7%) | 7557 (8%) | 14544 (8%) | |
70+ Yrs | 974 (6%) | 5286 (6%) | 10514 (6%) | |
Median HH Income | $55,636 | $50,807 | $52,351 | |
Total Household Income | < 24K | 931 (18%) | 6001 (21%) | 12293 (22%) |
25-49K | 1300 (26%) | 8020 (28%) | 13960 (25%) | |
50-74K | 1112 (22%) | 5757 (20%) | 10763 (19%) | |
75-99K | 754 (15%) | 3403 (11%) | 6234 (11%) | |
100-199K | 742 (15%) | 4747 (16%) | 9819 (17%) | |
200K+ | 99 (2%) | 525 (1%) | 1539 (2%) | |
Highest Education Level | No Diploma | 1748 | 12446 | 21128 |
Diploma or GED | 2776 | 17046 | 31251 | |
Some College | 1910 | 10821 | 20923 | |
Assoc. Degree | 525 | 3713 | 6278 | |
Bachelors Degree | 1046 | 5259 | 12222 | |
Higher Degree | 597 | 2407 | 6233 | |
Total Housing Units | 5,311 | 30,582 | 59,212 | |
--Owner-Occupied | 2,639 | 14,650 | 28,069 | |
--Renter-Occupied | 2,299 | 13,802 | 26,539 | |
Owner-Occupied Values | < 100K | 578 | 4143 | 8155 |
100-199K | 1694 | 8149 | 13261 | |
200-299K | 243 | 1783 | 4437 | |
300-399K | 99 | 330 | 1452 | |
400-499K | 17 | 30 | 238 | |
500K+ | 8 | 215 | 527 | |
Total Working Age Population | 10,704 | 63,569 | 124,932 | |
In Work Force | 7,481 | 44,126 | 86,851 | |
Not In Work Force | 3,223 | 19,443 | 38,081 | |
Workforce Employed | 6,925 | 40,570 | 76,337 | |
Workforce Unemployed | 417 | 3,182 | 6,609 | |
Civlian Workforce | 7,343 | 43,752 | 82,945 | |
Military Workforce | 138 | 374 | 3,906 | |
Total Households | 4,938 | 28,452 | 54,608 | |
Family Households | 3,381 | 19,433 | 37,386 | |
Non-Family Households | 1,557 | 9,019 | 17,223 | |
Married Couple | 2,088 | 12,962 | 24,037 | |
Other Family | 1,293 | 6,470 | 13,349 | |
Married w/Child | 1,018 | 6,379 | 11,548 | |
Single Male w/Child | 297 | 1,064 | 1,911 | |
Single Female w/Child | 567 | 2,830 | 6,156 |
Population Change Last Two Decades - Plus Projection
2000 | % | 2010 | % | 2020 | % | 2030 | |
---|---|---|---|---|---|---|---|
Illinois | 12,419,293 | +3 | 12,830,632 | +12 | 14,316,487 | +6 | 15,138,849 |
Lake County | 644,356 | +9 | 703,462 | +17 | 820,250 | +6 | 873,024 |
Total Working Age Population:
Total Households:
Total Working Age Population:
Total Households:
Total Working Age Population:
Total Households: