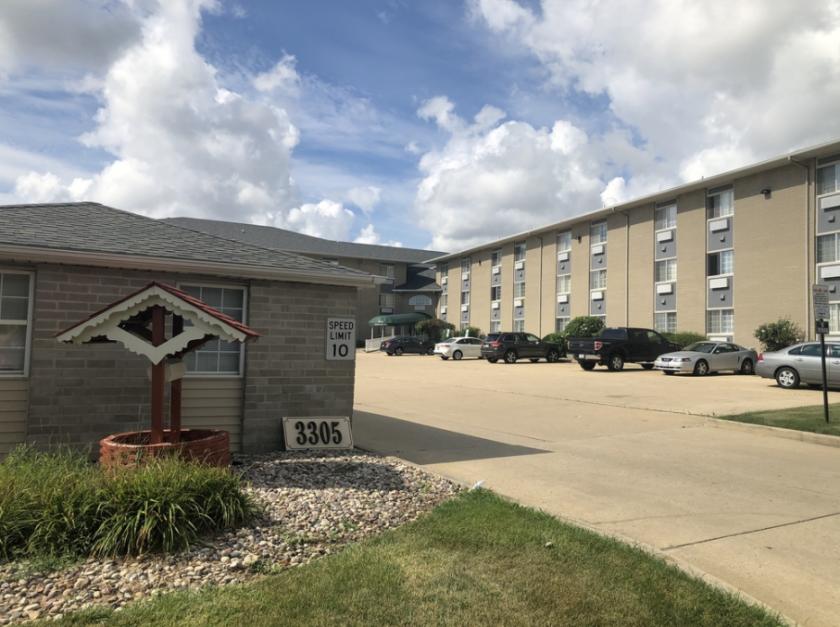
Multifamily Housing
3305 Sunset Avenue Waukegan, IL 60087
3305 Sunset Avenue Waukegan, IL 60087
Details & Description
Property Highlights
• Sale includes 63 Parcels out of 104 Units 60 of Total Units
• Opportunity for Cash Flow or Future Deconversion Sale
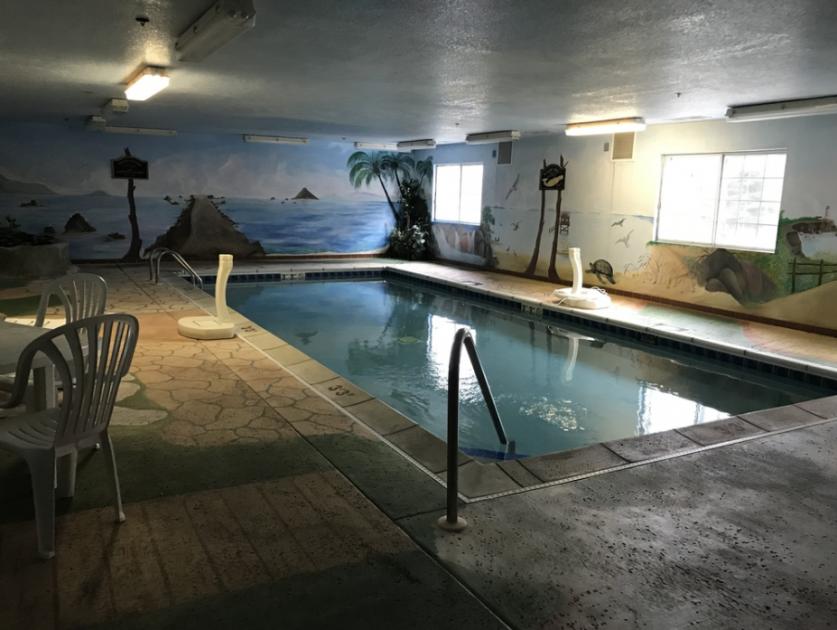
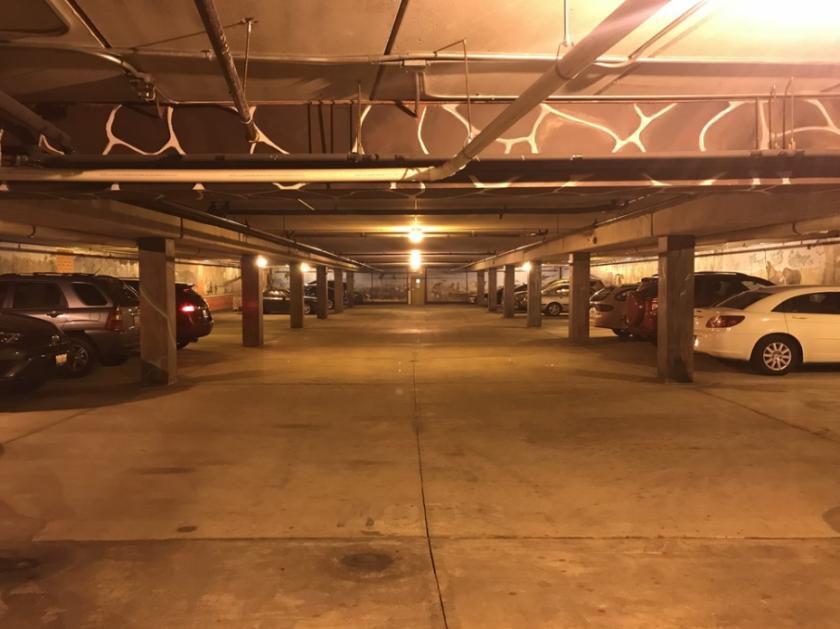
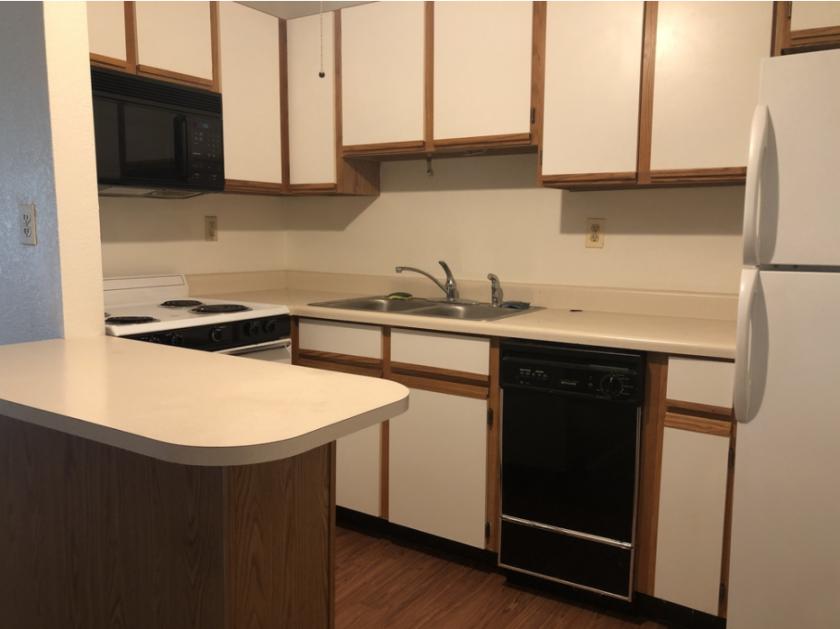
Additional Photos
Listing Agents

Danny Mantis
O: 773-293-5095
dmantis@kisergroup.com
O: 773-293-5095
dmantis@kisergroup.com

Matt Halper
O: 773-293-5092
mhalper@kisergroup.com
O: 773-293-5092
mhalper@kisergroup.com
While we strive to provide the most accurate information, all listing information, and demographic data, is provided by third-parties. As such, MyEListing will not be responsible for the accuracy of the information. It is strongly recommended that you verify all information with the listing agent, and any relevant agencies, prior to making any decisions.


