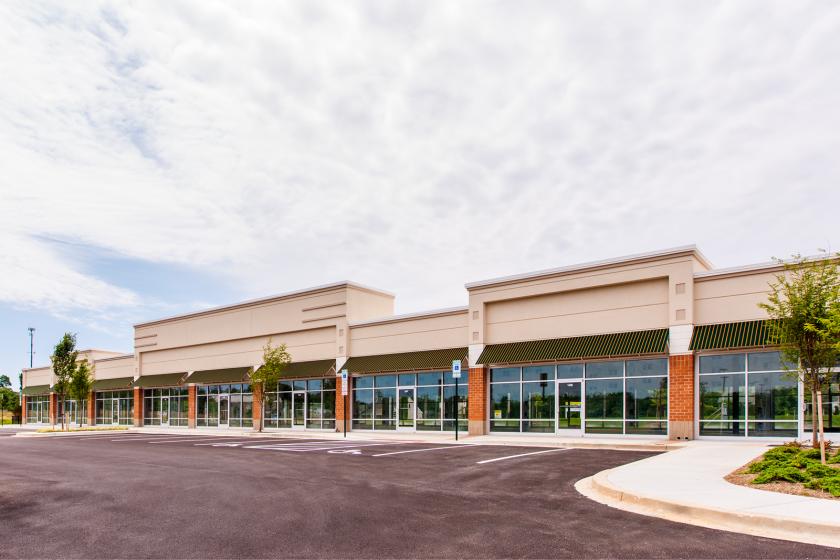
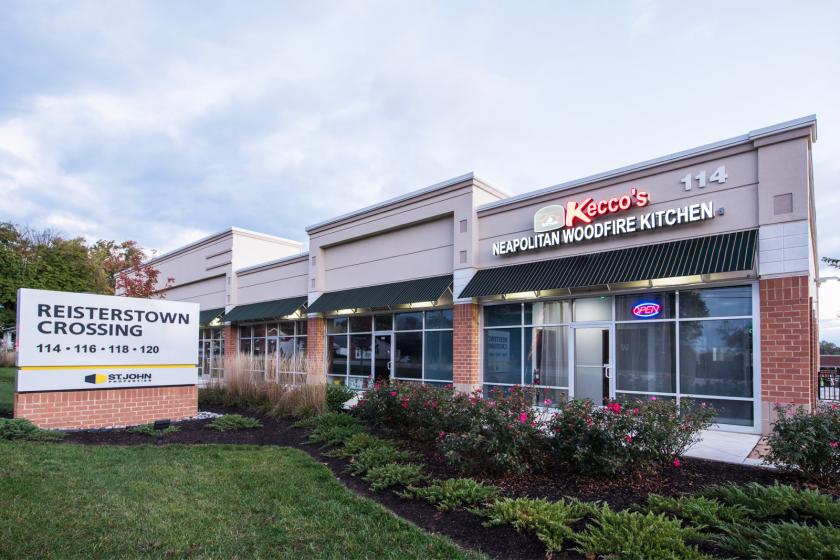
1-Mile | 3-Miles | 5-Miles | ||
---|---|---|---|---|
Total Population | 4,505 | 34,925 | 71,588 | |
Population Median Age | 44 | 40 | 39 | |
Population by Age | 0-9 Yrs | 305 (6%) | 3723 (10%) | 7837 (10%) |
10-19 Yrs | 666 (14%) | 5188 (14%) | 10256 (14%) | |
20-29 Yrs | 391 (8%) | 4017 (11%) | 9045 (12%) | |
30-39 Yrs | 371 (8%) | 3813 (10%) | 9241 (12%) | |
40-49 Yrs | 806 (17%) | 5464 (15%) | 10355 (14%) | |
50-59 Yrs | 671 (14%) | 5133 (14%) | 10127 (14%) | |
60-69 Yrs | 580 (12%) | 4137 (11%) | 8071 (11%) | |
70+ Yrs | 714 (15%) | 3450 (9%) | 6657 (9%) | |
Median HH Income | $83,205 | $80,248 | $84,000 | |
Total Household Income | < 24K | 336 (18%) | 2002 (15%) | 3373 (12%) |
25-49K | 252 (13%) | 1973 (15%) | 4323 (16%) | |
50-74K | 242 (13%) | 2101 (16%) | 4154 (15%) | |
75-99K | 228 (12%) | 1945 (14%) | 4035 (15%) | |
100-199K | 501 (27%) | 3446 (26%) | 7650 (28%) | |
200K+ | 251 (13%) | 1501 (11%) | 3071 (11%) | |
Highest Education Level | No Diploma | 226 | 2169 | 4390 |
Diploma or GED | 655 | 4656 | 10032 | |
Some College | 653 | 4657 | 9236 | |
Assoc. Degree | 355 | 2046 | 3541 | |
Bachelors Degree | 939 | 6373 | 13474 | |
Higher Degree | 534 | 4213 | 8209 | |
Total Housing Units | 1,824 | 13,571 | 28,155 | |
--Owner-Occupied | 1,229 | 9,053 | 17,567 | |
--Renter-Occupied | 581 | 3,915 | 9,039 | |
Owner-Occupied Values | < 100K | 7 | 514 | 709 |
100-199K | 180 | 1704 | 2999 | |
200-299K | 644 | 3162 | 5783 | |
300-399K | 200 | 1703 | 3155 | |
400-499K | 77 | 888 | 2113 | |
500K+ | 121 | 1082 | 2807 | |
Total Working Age Population | 3,814 | 27,955 | 57,901 | |
In Work Force | 2,536 | 19,620 | 40,399 | |
Not In Work Force | 1,277 | 8,335 | 17,502 | |
Workforce Employed | 2,426 | 18,455 | 38,099 | |
Workforce Unemployed | 109 | 1,143 | 2,213 | |
Civlian Workforce | 2,535 | 19,598 | 40,312 | |
Military Workforce | 2 | 22 | 88 | |
Total Households | 1,810 | 12,968 | 26,606 | |
Family Households | 1,237 | 9,557 | 18,666 | |
Non-Family Households | 574 | 3,411 | 7,940 | |
Married Couple | 919 | 6,461 | 12,854 | |
Other Family | 317 | 3,096 | 5,812 | |
Married w/Child | 348 | 2,548 | 5,140 | |
Single Male w/Child | 14 | 350 | 731 | |
Single Female w/Child | 106 | 1,301 | 2,211 |
Population Change Last Two Decades - Plus Projection
2000 | % | 2010 | % | 2020 | % | 2030 | |
---|---|---|---|---|---|---|---|
Maryland | 5,296,486 | +9 | 5,773,552 | +6 | 6,141,900 | +6 | 6,518,750 |
Baltimore County | 754,292 | +7 | 805,029 | +5 | 847,000 | +2 | 862,200 |
Carroll County | 150,897 | +11 | 167,134 | +1 | 169,200 | +4 | 175,150 |
Total Working Age Population:
Total Households:
Total Working Age Population:
Total Households:
Total Working Age Population:
Total Households: