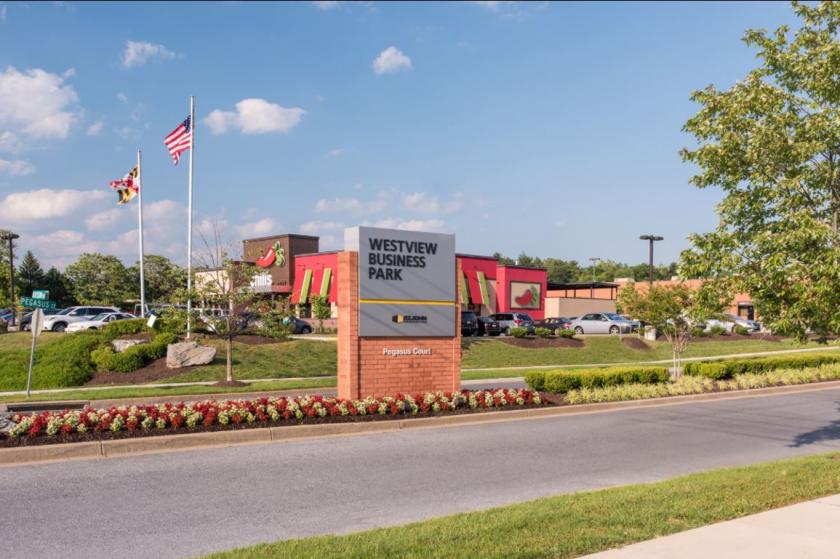
Flex-Office-Warehouse
5115 Pegasus Court Frederick, MD 21704
5115 Pegasus Court Frederick, MD 21704
Details & Description
Property Highlights
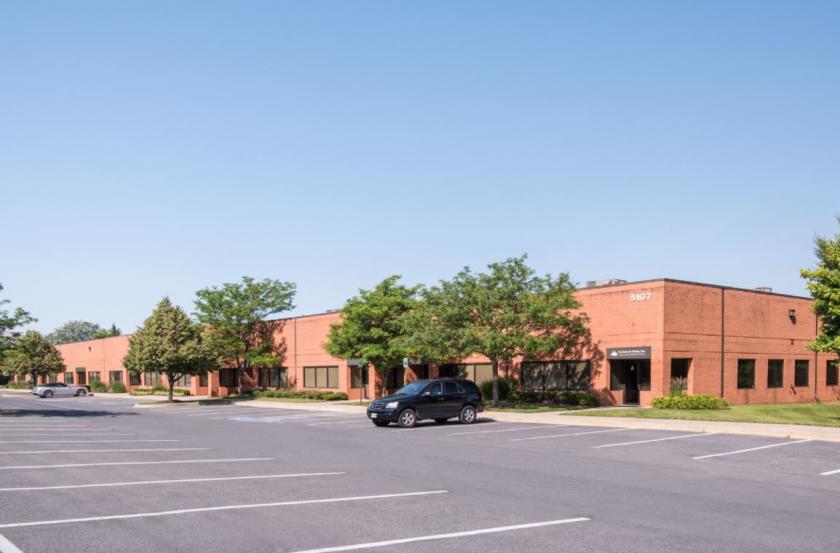
- • Construction Brick on block
- • Ceiling Height 16 ft. clear minimum
- • Roof EPDM Rubber
- • Parking 4 spaces per 1,000 sq. ft.
- • HVAC Gas
- • Zoning LI-Light Industrial
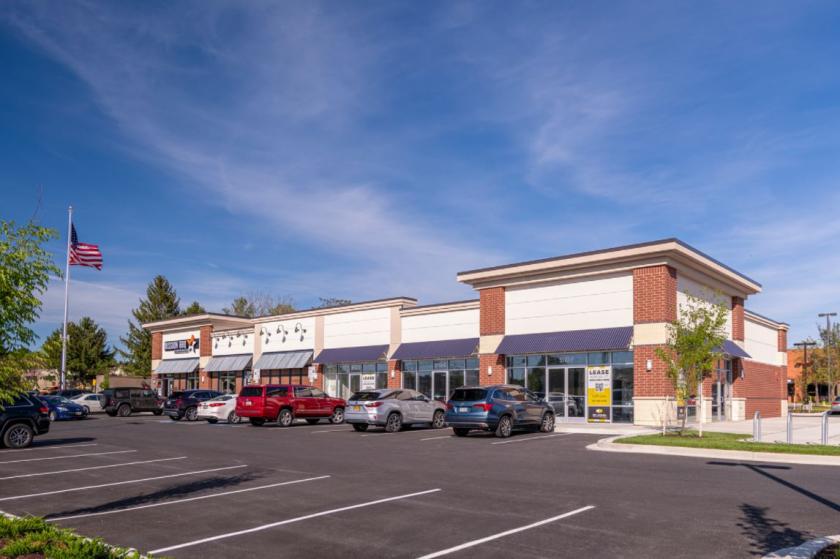
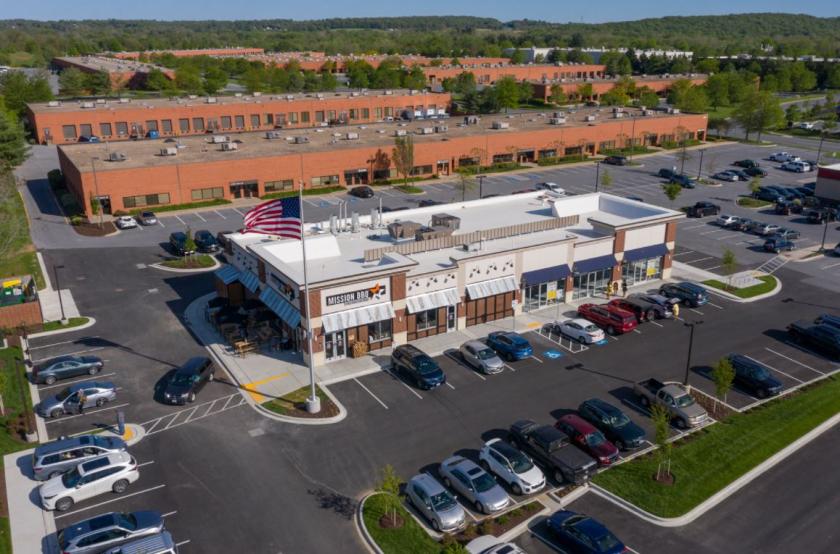
Additional Photos
Listing Agents

Danny Foit
O: 240-446-7985
dfoit@sjpi.com
O: 240-446-7985
dfoit@sjpi.com
While we strive to provide the most accurate information, all listing information, and demographic data, is provided by third-parties. As such, MyEListing will not be responsible for the accuracy of the information. It is strongly recommended that you verify all information with the listing agent, and any relevant agencies, prior to making any decisions.


