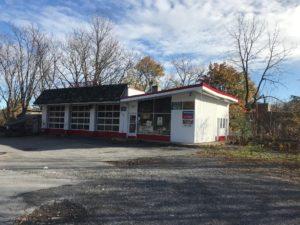
1-Mile | 3-Miles | 5-Miles | ||
---|---|---|---|---|
Total Population | 13,507 | 110,730 | 196,226 | |
Population Median Age | 39 | 36 | 37 | |
Population by Age | 0-9 Yrs | 1309 (9%) | 12282 (11%) | 23669 (12%) |
10-19 Yrs | 1833 (13%) | 19784 (17%) | 29531 (15%) | |
20-29 Yrs | 2529 (18%) | 21913 (19%) | 34299 (17%) | |
30-39 Yrs | 1740 (12%) | 13152 (11%) | 24865 (12%) | |
40-49 Yrs | 1323 (9%) | 10481 (9%) | 20119 (10%) | |
50-59 Yrs | 1542 (11%) | 12219 (11%) | 23998 (12%) | |
60-69 Yrs | 1798 (13%) | 10880 (9%) | 20568 (10%) | |
70+ Yrs | 1434 (10%) | 10018 (9%) | 19177 (9%) | |
Median HH Income | $60,754 | $40,501 | $45,625 | |
Total Household Income | < 24K | 1155 (21%) | 14114 (33%) | 23013 (29%) |
25-49K | 1130 (21%) | 10198 (24%) | 18622 (24%) | |
50-74K | 768 (14%) | 6319 (15%) | 12603 (16%) | |
75-99K | 610 (11%) | 4019 (9%) | 7980 (10%) | |
100-199K | 1243 (23%) | 5719 (13%) | 11619 (15%) | |
200K+ | 399 (7%) | 1487 (3%) | 2900 (3%) | |
Highest Education Level | No Diploma | 789 | 10214 | 18199 |
Diploma or GED | 1265 | 16094 | 32964 | |
Some College | 1468 | 11221 | 22239 | |
Assoc. Degree | 730 | 5644 | 11658 | |
Bachelors Degree | 1887 | 11054 | 20820 | |
Higher Degree | 2835 | 11216 | 18537 | |
Total Housing Units | 6,229 | 50,131 | 91,368 | |
--Owner-Occupied | 3,324 | 17,287 | 36,653 | |
--Renter-Occupied | 1,980 | 24,569 | 40,083 | |
Owner-Occupied Values | < 100K | 781 | 7111 | 15946 |
100-199K | 1762 | 6751 | 13718 | |
200-299K | 461 | 1606 | 3615 | |
300-399K | 193 | 773 | 1483 | |
400-499K | 70 | 423 | 742 | |
500K+ | 58 | 622 | 1148 | |
Total Working Age Population | 11,353 | 91,552 | 159,221 | |
In Work Force | 6,986 | 49,921 | 91,822 | |
Not In Work Force | 4,367 | 41,631 | 67,399 | |
Workforce Employed | 6,513 | 45,652 | 84,577 | |
Workforce Unemployed | 461 | 4,237 | 7,119 | |
Civlian Workforce | 6,974 | 49,888 | 91,696 | |
Military Workforce | 11 | 33 | 126 | |
Total Households | 5,304 | 41,855 | 76,736 | |
Family Households | 2,897 | 20,302 | 40,114 | |
Non-Family Households | 2,407 | 21,553 | 36,622 | |
Married Couple | 1,946 | 11,719 | 23,340 | |
Other Family | 951 | 8,584 | 16,773 | |
Married w/Child | 624 | 4,333 | 8,496 | |
Single Male w/Child | 50 | 865 | 1,747 | |
Single Female w/Child | 376 | 4,122 | 7,878 |
Population Change Last Two Decades - Plus Projection
2000 | % | 2010 | % | 2020 | % | 2030 | |
---|---|---|---|---|---|---|---|
New York | 18,976,457 | +2 | 19,378,102 | +4 | 20,146,131 | +2 | 20,604,030 |
Onondaga County | 458,336 | +2 | 467,026 | 0 | 467,461 | -1 | 463,795 |
Total Working Age Population:
Total Households:
Total Working Age Population:
Total Households:
Total Working Age Population:
Total Households: