Retail Space
399 Almonesson Road Deptford, NJ 08096
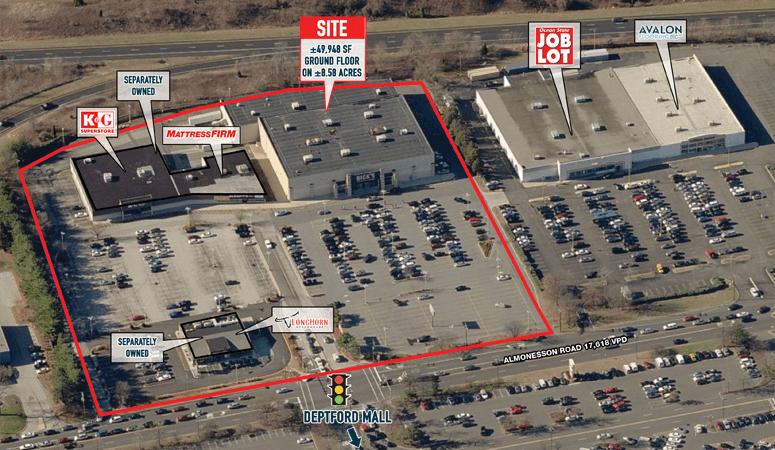
399 Almonesson Road Deptford, NJ 08096
Details & Description
Property Highlights
• Zoning is Business Center-2 with permitted uses including retail, medical, hotel, fitness, data center, office, auto se
• Signalized access from Almonesson Road with shared access with the Deptford Mall
Listing Agents

Joe Dougherty
O: 610-260-2670
M: 610-580-7663
jdougherty@metrocommercial.com
O: 610-260-2670
M: 610-580-7663
jdougherty@metrocommercial.com
While we strive to provide the most accurate information, all listing information, and demographic data, is provided by third-parties. As such, MyEListing will not be responsible for the accuracy of the information. It is strongly recommended that you verify all information with the listing agent, and any relevant agencies, prior to making any decisions.


