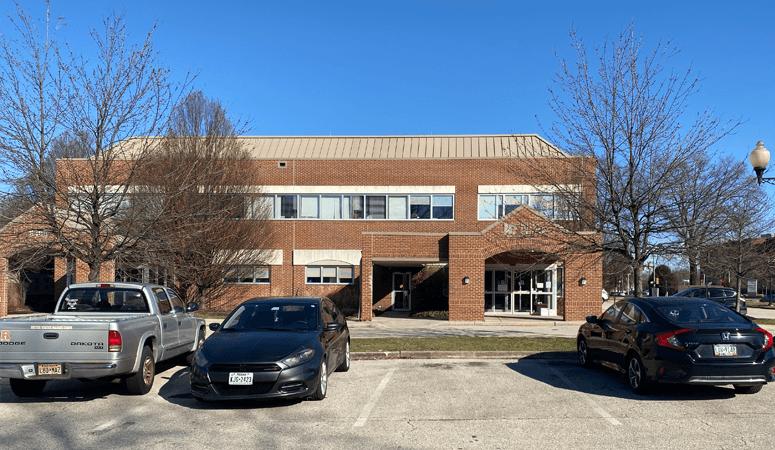
1-Mile | 3-Miles | 5-Miles | ||
---|---|---|---|---|
Total Population | 34,198 | 281,586 | 583,742 | |
Population Median Age | 42 | 38 | 38 | |
Population by Age | 0-9 Yrs | 3995 (11%) | 38758 (13%) | 80222 (13%) |
10-19 Yrs | 3247 (9%) | 32474 (11%) | 73128 (12%) | |
20-29 Yrs | 4461 (13%) | 37940 (13%) | 79636 (13%) | |
30-39 Yrs | 4671 (13%) | 43983 (15%) | 84233 (14%) | |
40-49 Yrs | 3889 (11%) | 33681 (11%) | 71515 (12%) | |
50-59 Yrs | 4355 (12%) | 35692 (12%) | 75617 (12%) | |
60-69 Yrs | 4205 (12%) | 29644 (10%) | 62180 (10%) | |
70+ Yrs | 5376 (15%) | 29415 (10%) | 57210 (9%) | |
Median HH Income | $49,727 | $51,507 | $53,085 | |
Total Household Income | < 24K | 3204 (24%) | 22791 (22%) | 48335 (23%) |
25-49K | 3425 (25%) | 26052 (25%) | 50013 (24%) | |
50-74K | 2423 (18%) | 18827 (18%) | 36846 (17%) | |
75-99K | 1234 (9%) | 11528 (11%) | 24695 (11%) | |
100-199K | 2626 (19%) | 18363 (18%) | 38533 (18%) | |
200K+ | 287 (2%) | 2753 (2%) | 8711 (4%) | |
Highest Education Level | No Diploma | 3564 | 29925 | 57938 |
Diploma or GED | 9217 | 72264 | 144462 | |
Some College | 3657 | 34154 | 67052 | |
Assoc. Degree | 1718 | 13135 | 28484 | |
Bachelors Degree | 4632 | 30561 | 64101 | |
Higher Degree | 2397 | 14653 | 34002 | |
Total Housing Units | 13,680 | 107,779 | 224,181 | |
--Owner-Occupied | 7,364 | 60,944 | 129,067 | |
--Renter-Occupied | 5,834 | 39,369 | 78,068 | |
Owner-Occupied Values | < 100K | 191 | 5689 | 19161 |
100-199K | 3753 | 34234 | 60867 | |
200-299K | 2890 | 15607 | 32506 | |
300-399K | 387 | 3716 | 9868 | |
400-499K | 71 | 974 | 3328 | |
500K+ | 72 | 723 | 3336 | |
Total Working Age Population | 28,446 | 222,924 | 457,340 | |
In Work Force | 16,158 | 138,777 | 286,498 | |
Not In Work Force | 12,289 | 84,147 | 170,841 | |
Workforce Employed | 15,206 | 127,716 | 261,847 | |
Workforce Unemployed | 952 | 10,970 | 24,428 | |
Civlian Workforce | 16,158 | 138,686 | 286,275 | |
Military Workforce | 0 | 91 | 223 | |
Total Households | 13,199 | 100,313 | 207,134 | |
Family Households | 7,677 | 65,643 | 135,557 | |
Non-Family Households | 5,522 | 34,670 | 71,577 | |
Married Couple | 5,558 | 42,070 | 84,427 | |
Other Family | 2,119 | 23,573 | 51,130 | |
Married w/Child | 1,958 | 17,315 | 33,519 | |
Single Male w/Child | 164 | 2,629 | 5,754 | |
Single Female w/Child | 726 | 8,851 | 19,693 |
Population Change Last Two Decades - Plus Projection
2000 | % | 2010 | % | 2020 | % | 2030 | |
---|---|---|---|---|---|---|---|
New Jersey | 8,414,350 | +4 | 8,791,894 | +4 | 9,132,700 | +4 | 9,530,900 |
Burlington County | 423,394 | +6 | 448,734 | 0 | 450,000 | +3 | 464,900 |
Camden County | 508,932 | +1 | 513,657 | 0 | 511,800 | +2 | 521,000 |
Pennsylvania | 12,281,054 | +3 | 12,702,379 | +4 | 13,230,170 | +4 | 13,759,594 |
Bucks County | 597,635 | +5 | 625,249 | +1 | 629,420 | +1 | 637,730 |
Montgomery County | 750,097 | +7 | 799,874 | +5 | 838,883 | +6 | 891,868 |
Philadelphia County | 1,517,550 | +1 | 1,526,006 | +8 | 1,653,729 | +6 | 1,753,054 |
Total Working Age Population:
Total Households:
Total Working Age Population:
Total Households:
Total Working Age Population:
Total Households: