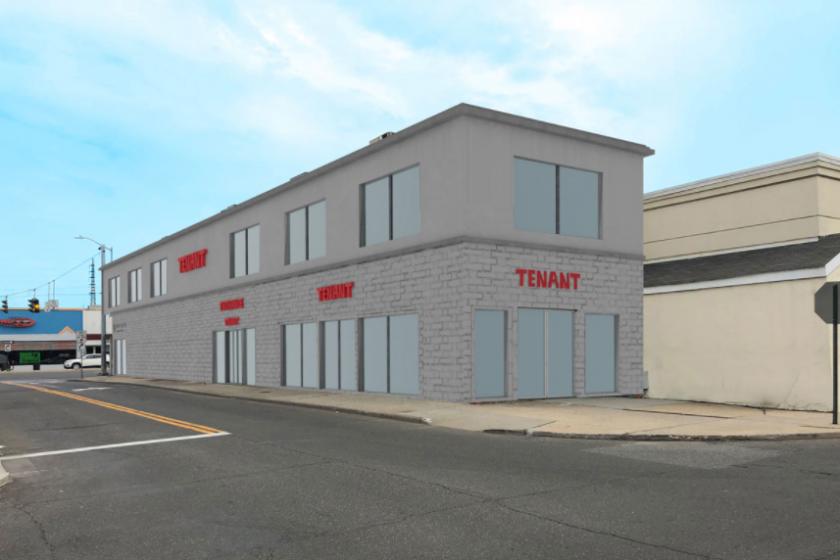
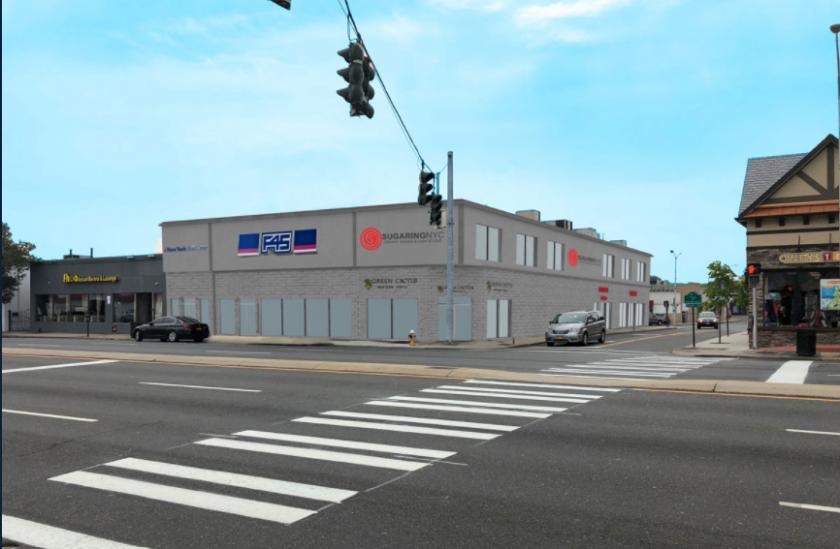
1-Mile | 3-Miles | 5-Miles | ||
---|---|---|---|---|
Total Population | 25,621 | 207,131 | 561,945 | |
Population Median Age | 41 | 41 | 39 | |
Population by Age | 0-9 Yrs | 2873 (11%) | 23048 (11%) | 66889 (11%) |
10-19 Yrs | 3302 (12%) | 26835 (12%) | 73204 (13%) | |
20-29 Yrs | 2736 (10%) | 24481 (11%) | 73731 (13%) | |
30-39 Yrs | 3090 (12%) | 24263 (11%) | 68093 (12%) | |
40-49 Yrs | 3144 (12%) | 27117 (13%) | 73775 (13%) | |
50-59 Yrs | 3649 (14%) | 31685 (15%) | 81875 (14%) | |
60-69 Yrs | 3332 (13%) | 26246 (12%) | 65784 (11%) | |
70+ Yrs | 3494 (13%) | 23455 (11%) | 58595 (10%) | |
Median HH Income | $95,823 | $110,841 | $103,902 | |
Total Household Income | < 24K | 1515 (14%) | 7288 (10%) | 19265 (10%) |
25-49K | 1489 (14%) | 8360 (11%) | 23389 (13%) | |
50-74K | 982 (9%) | 8269 (11%) | 22116 (12%) | |
75-99K | 1303 (12%) | 8150 (11%) | 21279 (11%) | |
100-199K | 2612 (25%) | 23663 (33%) | 59687 (33%) | |
200K+ | 2241 (22%) | 14452 (20%) | 32214 (18%) | |
Highest Education Level | No Diploma | 1421 | 12366 | 44031 |
Diploma or GED | 3677 | 34245 | 96260 | |
Some College | 2726 | 22772 | 63059 | |
Assoc. Degree | 1315 | 12787 | 32028 | |
Bachelors Degree | 4961 | 35417 | 84862 | |
Higher Degree | 4185 | 27962 | 64786 | |
Total Housing Units | 10,622 | 73,649 | 187,891 | |
--Owner-Occupied | 6,654 | 56,191 | 135,185 | |
--Renter-Occupied | 3,487 | 13,991 | 42,766 | |
Owner-Occupied Values | < 100K | 92 | 1167 | 2877 |
100-199K | 224 | 1923 | 4051 | |
200-299K | 629 | 4804 | 12923 | |
300-399K | 971 | 12638 | 31698 | |
400-499K | 1172 | 15888 | 35556 | |
500K+ | 3566 | 19772 | 48080 | |
Total Working Age Population | 20,831 | 168,097 | 452,164 | |
In Work Force | 13,700 | 111,749 | 299,534 | |
Not In Work Force | 7,131 | 56,348 | 152,630 | |
Workforce Employed | 13,131 | 106,875 | 285,738 | |
Workforce Unemployed | 569 | 4,862 | 13,740 | |
Civlian Workforce | 13,700 | 111,737 | 299,478 | |
Military Workforce | 0 | 12 | 56 | |
Total Households | 10,141 | 70,182 | 177,951 | |
Family Households | 6,437 | 52,768 | 136,006 | |
Non-Family Households | 3,704 | 17,414 | 41,945 | |
Married Couple | 5,014 | 40,484 | 98,252 | |
Other Family | 1,422 | 12,284 | 37,754 | |
Married w/Child | 2,138 | 17,057 | 42,635 | |
Single Male w/Child | 208 | 1,098 | 3,399 | |
Single Female w/Child | 535 | 3,720 | 11,005 |
Population Change Last Two Decades - Plus Projection
2000 | % | 2010 | % | 2020 | % | 2030 | |
---|---|---|---|---|---|---|---|
New York | 18,976,457 | +2 | 19,378,102 | +4 | 20,146,131 | +2 | 20,604,030 |
Nassau County | 1,334,544 | 0 | 1,339,532 | +4 | 1,386,500 | +3 | 1,432,859 |
Queens County | 2,229,379 | 0 | 2,230,722 | +9 | 2,436,549 | +5 | 2,565,268 |
Total Working Age Population:
Total Households:
Total Working Age Population:
Total Households:
Total Working Age Population:
Total Households: