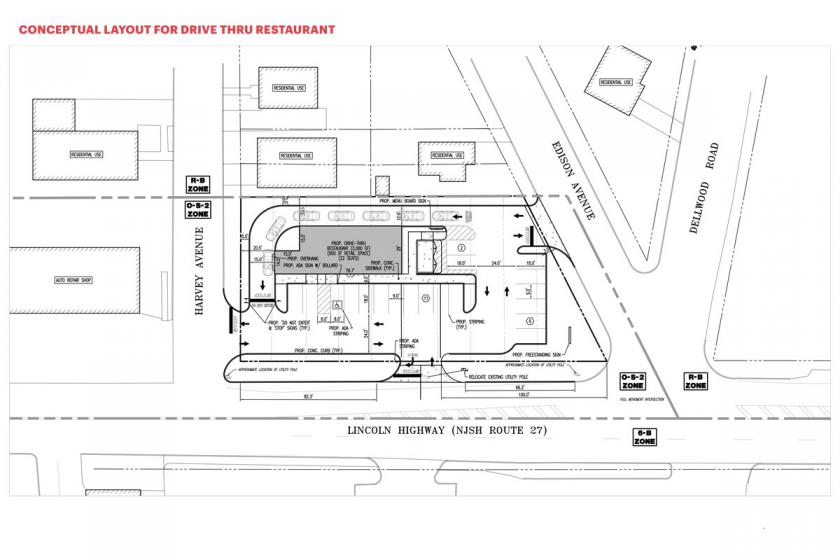
Commercial Land
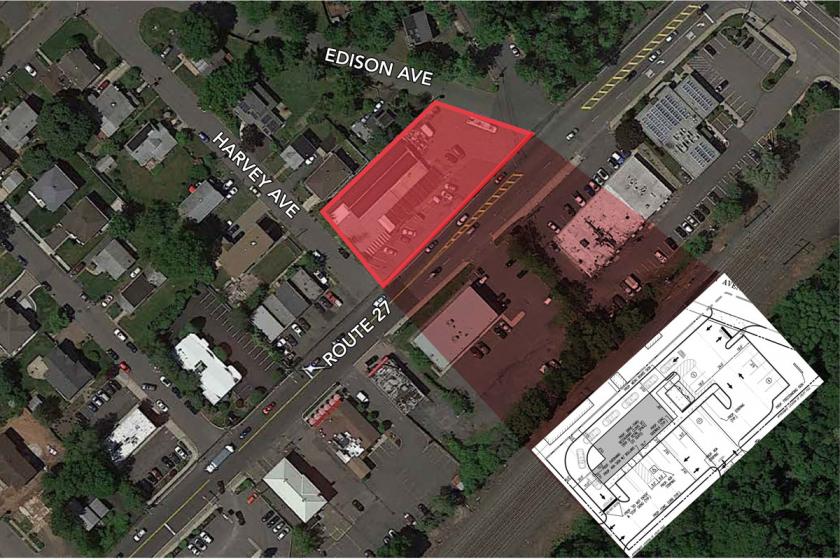
92 New Jersey 27 Edison, NJ 08820
92 New Jersey 27 Edison, NJ 08820
Details & Description
Property Highlights
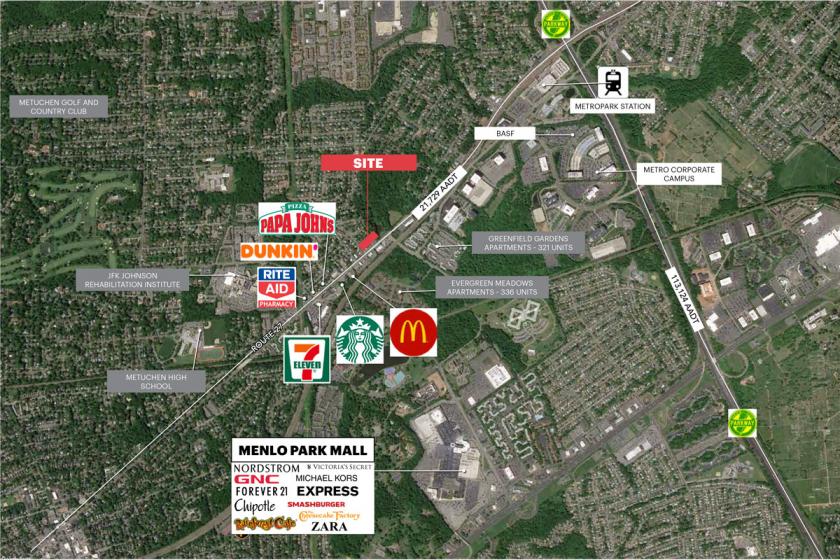
• Less than one mile from Menlo Park and Garden State Parkway
• Less than one mile from Menlo Park and Garden State Parkway
Listing Agents

Jake Frantzman
O: 201-777-2309
jfrantzman@ripconj.com
O: 201-777-2309
jfrantzman@ripconj.com

Daniel Zappala
O: 201-777-2312
dzappala@ripconj.com
O: 201-777-2312
dzappala@ripconj.com
While we strive to provide the most accurate information, all listing information, and demographic data, is provided by third-parties. As such, MyEListing will not be responsible for the accuracy of the information. It is strongly recommended that you verify all information with the listing agent, and any relevant agencies, prior to making any decisions.