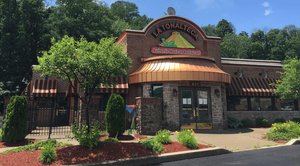
1-Mile | 3-Miles | 5-Miles | ||
---|---|---|---|---|
Total Population | 2,740 | 22,863 | 35,726 | |
Population Median Age | 43 | 44 | 43 | |
Population by Age | 0-9 Yrs | 203 (7%) | 2138 (9%) | 3517 (9%) |
10-19 Yrs | 400 (14%) | 2479 (10%) | 4158 (11%) | |
20-29 Yrs | 261 (9%) | 2847 (12%) | 4122 (11%) | |
30-39 Yrs | 296 (10%) | 2779 (12%) | 4219 (11%) | |
40-49 Yrs | 358 (13%) | 2505 (10%) | 4056 (11%) | |
50-59 Yrs | 428 (15%) | 2957 (12%) | 4725 (13%) | |
60-69 Yrs | 412 (15%) | 3647 (15%) | 5589 (15%) | |
70+ Yrs | 382 (13%) | 3510 (15%) | 5339 (14%) | |
Median HH Income | $45,384 | $43,653 | $44,558 | |
Total Household Income | < 24K | 353 (31%) | 2945 (29%) | 4315 (28%) |
25-49K | 241 (21%) | 2551 (25%) | 4096 (26%) | |
50-74K | 139 (12%) | 1468 (14%) | 2446 (16%) | |
75-99K | 136 (11%) | 1085 (11%) | 1746 (11%) | |
100-199K | 177 (15%) | 1427 (14%) | 2147 (14%) | |
200K+ | 90 (7%) | 379 (3%) | 509 (3%) | |
Highest Education Level | No Diploma | 207 | 1781 | 2548 |
Diploma or GED | 703 | 7366 | 12298 | |
Some College | 370 | 2641 | 3913 | |
Assoc. Degree | 148 | 1479 | 2211 | |
Bachelors Degree | 325 | 2501 | 3555 | |
Higher Degree | 256 | 1320 | 1818 | |
Total Housing Units | 1,290 | 11,464 | 17,638 | |
--Owner-Occupied | 748 | 6,679 | 10,743 | |
--Renter-Occupied | 387 | 3,176 | 4,516 | |
Owner-Occupied Values | < 100K | 201 | 3007 | 4972 |
100-199K | 311 | 2164 | 3509 | |
200-299K | 94 | 780 | 1181 | |
300-399K | 79 | 404 | 613 | |
400-499K | 24 | 215 | 316 | |
500K+ | 40 | 110 | 152 | |
Total Working Age Population | 2,272 | 19,144 | 29,787 | |
In Work Force | 1,238 | 10,125 | 15,765 | |
Not In Work Force | 1,034 | 9,019 | 14,022 | |
Workforce Employed | 1,170 | 9,255 | 14,345 | |
Workforce Unemployed | 69 | 870 | 1,417 | |
Civlian Workforce | 1,238 | 10,125 | 15,761 | |
Military Workforce | 0 | 0 | 4 | |
Total Households | 1,135 | 9,854 | 15,260 | |
Family Households | 716 | 5,560 | 9,063 | |
Non-Family Households | 420 | 4,294 | 6,197 | |
Married Couple | 514 | 3,870 | 6,231 | |
Other Family | 202 | 1,690 | 2,832 | |
Married w/Child | 201 | 1,331 | 2,090 | |
Single Male w/Child | 11 | 177 | 294 | |
Single Female w/Child | 73 | 619 | 1,048 |
Population Change Last Two Decades - Plus Projection
2000 | % | 2010 | % | 2020 | % | 2030 | |
---|---|---|---|---|---|---|---|
Pennsylvania | 12,281,054 | +3 | 12,702,379 | +4 | 13,230,170 | +4 | 13,759,594 |
Fayette County | 148,644 | -8 | 136,606 | +1 | 137,756 | +2 | 139,981 |
Total Working Age Population:
Total Households:
Total Working Age Population:
Total Households:
Total Working Age Population:
Total Households: