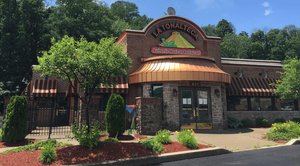
1-Mile | 3-Miles | 5-Miles | ||
---|---|---|---|---|
Total Population | 4,500 | 34,754 | 120,342 | |
Population Median Age | 43 | 42 | 38 | |
Population by Age | 0-9 Yrs | 466 (10%) | 3734 (10%) | 15426 (12%) |
10-19 Yrs | 488 (10%) | 4244 (12%) | 17000 (14%) | |
20-29 Yrs | 534 (11%) | 4221 (12%) | 16988 (14%) | |
30-39 Yrs | 517 (11%) | 3935 (11%) | 15064 (12%) | |
40-49 Yrs | 547 (12%) | 3841 (11%) | 14445 (12%) | |
50-59 Yrs | 709 (15%) | 4940 (14%) | 15403 (12%) | |
60-69 Yrs | 616 (13%) | 4560 (13%) | 13457 (11%) | |
70+ Yrs | 623 (13%) | 5281 (15%) | 12559 (10%) | |
Median HH Income | $79,826 | $70,630 | $57,245 | |
Total Household Income | < 24K | 170 (9%) | 2341 (16%) | 9842 (21%) |
25-49K | 374 (20%) | 2482 (17%) | 9994 (21%) | |
50-74K | 286 (15%) | 2692 (19%) | 8790 (19%) | |
75-99K | 356 (19%) | 2121 (14%) | 5557 (12%) | |
100-199K | 527 (29%) | 3599 (25%) | 9291 (20%) | |
200K+ | 84 (4%) | 908 (6%) | 2104 (4%) | |
Highest Education Level | No Diploma | 292 | 1741 | 9414 |
Diploma or GED | 1062 | 8011 | 29260 | |
Some College | 563 | 4493 | 13101 | |
Assoc. Degree | 304 | 2180 | 6878 | |
Bachelors Degree | 766 | 5032 | 12608 | |
Higher Degree | 354 | 3063 | 7792 | |
Total Housing Units | 1,873 | 14,826 | 49,428 | |
--Owner-Occupied | 1,363 | 10,524 | 28,861 | |
--Renter-Occupied | 433 | 3,618 | 16,717 | |
Owner-Occupied Values | < 100K | 119 | 980 | 5883 |
100-199K | 713 | 5101 | 12600 | |
200-299K | 319 | 2419 | 6054 | |
300-399K | 103 | 1291 | 2832 | |
400-499K | 33 | 423 | 723 | |
500K+ | 77 | 310 | 769 | |
Total Working Age Population | 3,717 | 28,553 | 95,227 | |
In Work Force | 2,514 | 17,917 | 60,250 | |
Not In Work Force | 1,203 | 10,636 | 34,977 | |
Workforce Employed | 2,479 | 17,412 | 56,795 | |
Workforce Unemployed | 34 | 501 | 3,390 | |
Civlian Workforce | 2,513 | 17,913 | 60,185 | |
Military Workforce | 1 | 4 | 66 | |
Total Households | 1,796 | 14,142 | 45,578 | |
Family Households | 1,256 | 9,354 | 29,698 | |
Non-Family Households | 540 | 4,789 | 15,880 | |
Married Couple | 1,060 | 7,547 | 20,438 | |
Other Family | 196 | 1,807 | 9,260 | |
Married w/Child | 373 | 2,619 | 7,735 | |
Single Male w/Child | 35 | 216 | 1,209 | |
Single Female w/Child | 33 | 711 | 4,339 |
Population Change Last Two Decades - Plus Projection
2000 | % | 2010 | % | 2020 | % | 2030 | |
---|---|---|---|---|---|---|---|
Pennsylvania | 12,281,054 | +3 | 12,702,379 | +4 | 13,230,170 | +4 | 13,759,594 |
Lancaster County | 470,658 | +10 | 519,445 | +8 | 559,247 | +8 | 602,153 |
York County | 381,751 | +14 | 434,972 | +6 | 460,514 | +5 | 484,497 |
Total Working Age Population:
Total Households:
Total Working Age Population:
Total Households:
Total Working Age Population:
Total Households: