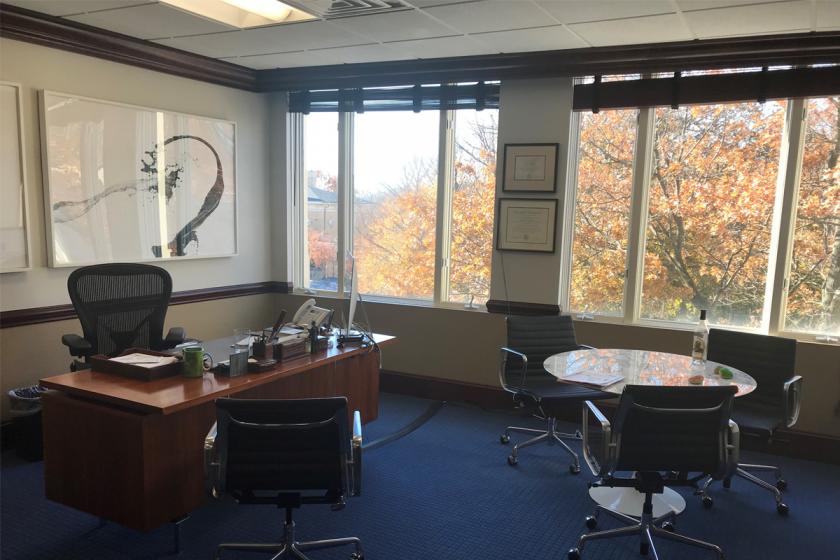
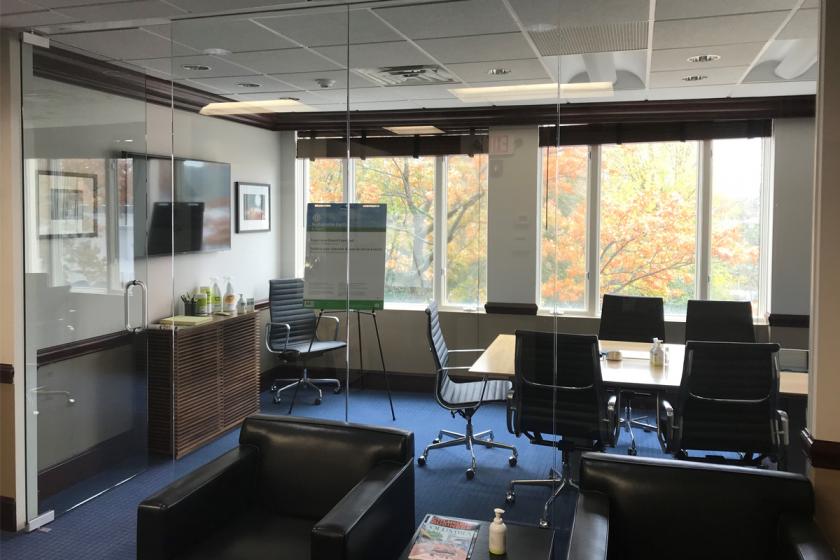
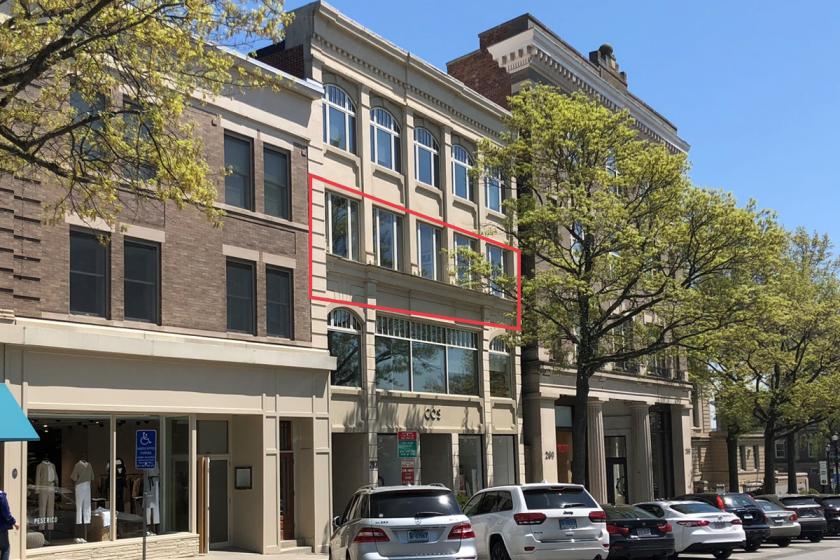
1-Mile | 3-Miles | 5-Miles | ||
---|---|---|---|---|
Total Population | 10,272 | 78,022 | 173,239 | |
Population Median Age | 42 | 40 | 39 | |
Population by Age | 0-9 Yrs | 1293 (12%) | 9643 (12%) | 21020 (12%) |
10-19 Yrs | 956 (9%) | 10434 (13%) | 24889 (14%) | |
20-29 Yrs | 1095 (10%) | 8094 (10%) | 19866 (11%) | |
30-39 Yrs | 1315 (12%) | 9124 (11%) | 20939 (12%) | |
40-49 Yrs | 1219 (11%) | 12048 (15%) | 25720 (14%) | |
50-59 Yrs | 1702 (16%) | 11161 (14%) | 23561 (13%) | |
60-69 Yrs | 1283 (12%) | 8641 (11%) | 17892 (10%) | |
70+ Yrs | 1407 (13%) | 8877 (11%) | 19352 (11%) | |
Median HH Income | $101,779 | $115,422 | $111,035 | |
Total Household Income | < 24K | 850 (18%) | 3185 (11%) | 7617 (12%) |
25-49K | 661 (14%) | 3464 (12%) | 8225 (13%) | |
50-74K | 370 (8%) | 2912 (10%) | 6705 (11%) | |
75-99K | 325 (7%) | 2777 (10%) | 5875 (9%) | |
100-199K | 1122 (25%) | 6419 (23%) | 13812 (22%) | |
200K+ | 1145 (25%) | 8694 (31%) | 18676 (30%) | |
Highest Education Level | No Diploma | 398 | 5812 | 12444 |
Diploma or GED | 1365 | 9918 | 20686 | |
Some College | 961 | 6110 | 13331 | |
Assoc. Degree | 390 | 2948 | 5943 | |
Bachelors Degree | 2268 | 15314 | 33493 | |
Higher Degree | 2205 | 13695 | 30798 | |
Total Housing Units | 5,075 | 29,884 | 66,320 | |
--Owner-Occupied | 1,900 | 16,271 | 34,020 | |
--Renter-Occupied | 2,574 | 11,180 | 26,891 | |
Owner-Occupied Values | < 100K | 13 | 331 | 764 |
100-199K | 72 | 344 | 1000 | |
200-299K | 59 | 586 | 1603 | |
300-399K | 120 | 945 | 2244 | |
400-499K | 175 | 1304 | 2430 | |
500K+ | 1461 | 12761 | 25980 | |
Total Working Age Population | 8,470 | 62,148 | 138,029 | |
In Work Force | 5,267 | 40,961 | 91,175 | |
Not In Work Force | 3,203 | 21,187 | 46,855 | |
Workforce Employed | 4,981 | 38,486 | 85,210 | |
Workforce Unemployed | 286 | 2,452 | 5,942 | |
Civlian Workforce | 5,267 | 40,938 | 91,152 | |
Military Workforce | 0 | 23 | 23 | |
Total Households | 4,474 | 27,451 | 60,911 | |
Family Households | 2,504 | 19,401 | 41,896 | |
Non-Family Households | 1,970 | 8,049 | 19,016 | |
Married Couple | 1,827 | 15,411 | 32,777 | |
Other Family | 677 | 3,991 | 9,118 | |
Married w/Child | 793 | 7,255 | 15,655 | |
Single Male w/Child | 79 | 667 | 1,455 | |
Single Female w/Child | 235 | 1,222 | 3,180 |
Population Change Last Two Decades - Plus Projection
2000 | % | 2010 | % | 2020 | % | 2030 | |
---|---|---|---|---|---|---|---|
Connecticut | 3,405,565 | +5 | 3,574,097 | +1 | 3,604,603 | +1 | 3,633,994 |
Fairfield County | 882,567 | +4 | 916,829 | -1 | 907,603 | -1 | 897,553 |
New York | 18,976,457 | +2 | 19,378,102 | +4 | 20,146,131 | +2 | 20,604,030 |
Nassau County | 1,334,544 | 0 | 1,339,532 | +4 | 1,386,500 | +3 | 1,432,859 |
Westchester County | 923,459 | +3 | 949,113 | +5 | 996,039 | +4 | 1,037,234 |
Total Working Age Population:
Total Households:
Total Working Age Population:
Total Households:
Total Working Age Population:
Total Households: