Retail Space
63 Flushing Avenue Brooklyn, NY 11205
63 Flushing Avenue Brooklyn, NY 11205
Details & Description
Property Highlights
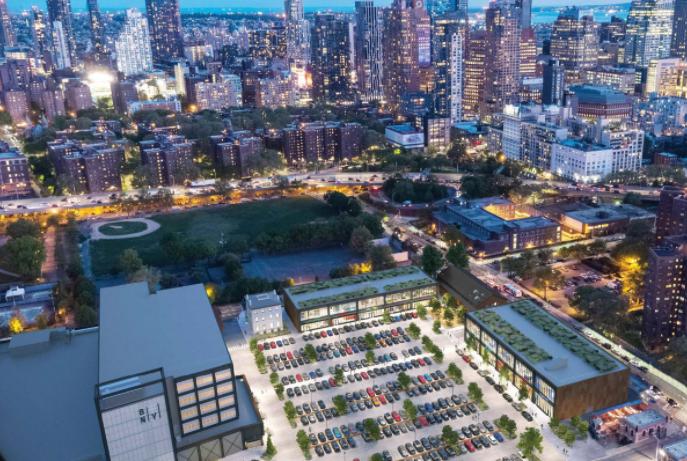
• Anchored by New York Citys first Wegmans Grocery, 75,000 customers expected per week
• 700 parking spaces available between parking garage and parking lot
Listing Agents

Jason Pennington
O: 718-233-6565
jpennington@ripcony.com
O: 718-233-6565
jpennington@ripcony.com
While we strive to provide the most accurate information, all listing information, and demographic data, is provided by third-parties. As such, MyEListing will not be responsible for the accuracy of the information. It is strongly recommended that you verify all information with the listing agent, and any relevant agencies, prior to making any decisions.


