Retail Space
200 North Broad Street Lansdale, PA 19446
200 North Broad Street Lansdale, PA 19446
Details & Description
Property Highlights
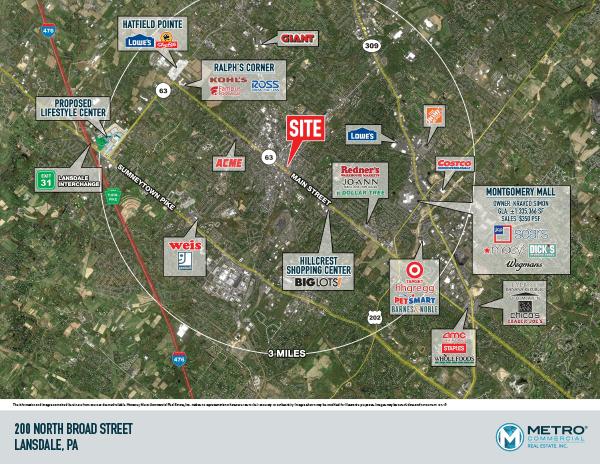
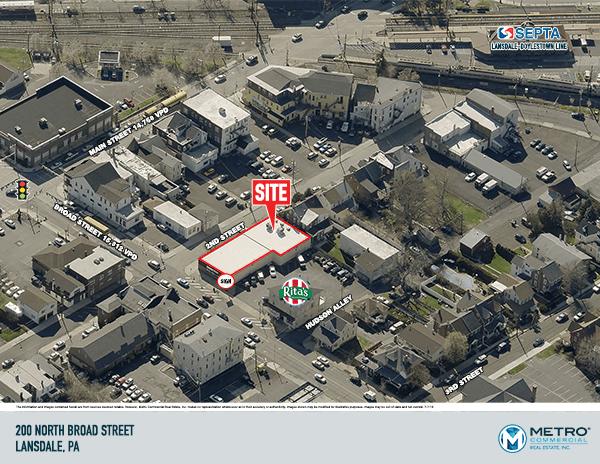
• Freestanding building in the heart of Lansdale
• Visibility from both Broad and Main Street
Listing Agents

Brandon Anapol
O: 610-260-2675
M: 215-510-7292
banapol@metrocommercial.com
O: 610-260-2675
M: 215-510-7292
banapol@metrocommercial.com
While we strive to provide the most accurate information, all listing information, and demographic data, is provided by third-parties. As such, MyEListing will not be responsible for the accuracy of the information. It is strongly recommended that you verify all information with the listing agent, and any relevant agencies, prior to making any decisions.