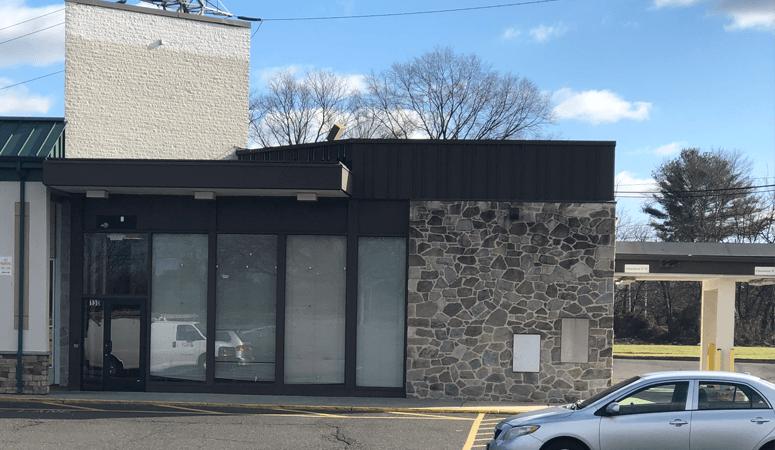
1-Mile | 3-Miles | 5-Miles | ||
---|---|---|---|---|
Total Population | 15,441 | 65,609 | 161,343 | |
Population Median Age | 41 | 41 | 40 | |
Population by Age | 0-9 Yrs | 1686 (10%) | 6887 (10%) | 17938 (11%) |
10-19 Yrs | 1794 (11%) | 8109 (12%) | 19893 (12%) | |
20-29 Yrs | 2157 (13%) | 8744 (13%) | 20691 (12%) | |
30-39 Yrs | 1535 (9%) | 7335 (11%) | 19893 (12%) | |
40-49 Yrs | 1930 (12%) | 9502 (14%) | 22404 (13%) | |
50-59 Yrs | 2447 (15%) | 10037 (15%) | 24390 (15%) | |
60-69 Yrs | 1853 (12%) | 7435 (11%) | 18771 (11%) | |
70+ Yrs | 2038 (13%) | 7560 (11%) | 17362 (10%) | |
Median HH Income | $77,252 | $80,790 | $79,626 | |
Total Household Income | < 24K | 568 (11%) | 2628 (11%) | 7656 (12%) |
25-49K | 777 (15%) | 3730 (15%) | 10229 (16%) | |
50-74K | 1120 (21%) | 4423 (18%) | 10615 (17%) | |
75-99K | 905 (17%) | 4010 (17%) | 9210 (15%) | |
100-199K | 1508 (29%) | 6938 (29%) | 17180 (28%) | |
200K+ | 215 (4%) | 1691 (7%) | 5520 (9%) | |
Highest Education Level | No Diploma | 811 | 3422 | 8991 |
Diploma or GED | 3703 | 15847 | 37166 | |
Some College | 2642 | 10143 | 22167 | |
Assoc. Degree | 893 | 3786 | 8982 | |
Bachelors Degree | 1966 | 8527 | 23041 | |
Higher Degree | 728 | 4643 | 12912 | |
Total Housing Units | 5,698 | 25,765 | 66,113 | |
--Owner-Occupied | 4,426 | 17,866 | 44,293 | |
--Renter-Occupied | 667 | 5,554 | 16,116 | |
Owner-Occupied Values | < 100K | 313 | 1582 | 2982 |
100-199K | 3177 | 8783 | 18046 | |
200-299K | 782 | 4506 | 13309 | |
300-399K | 87 | 1704 | 5407 | |
400-499K | 0 | 557 | 1843 | |
500K+ | 67 | 734 | 2707 | |
Total Working Age Population | 12,792 | 54,247 | 131,416 | |
In Work Force | 8,240 | 36,739 | 89,932 | |
Not In Work Force | 4,552 | 17,508 | 41,484 | |
Workforce Employed | 7,262 | 33,492 | 82,860 | |
Workforce Unemployed | 951 | 3,090 | 6,529 | |
Civlian Workforce | 8,213 | 36,582 | 89,389 | |
Military Workforce | 27 | 157 | 543 | |
Total Households | 5,094 | 23,420 | 60,409 | |
Family Households | 3,998 | 16,861 | 41,781 | |
Non-Family Households | 1,096 | 6,559 | 18,628 | |
Married Couple | 2,478 | 11,002 | 28,973 | |
Other Family | 1,520 | 5,859 | 12,808 | |
Married w/Child | 726 | 3,648 | 10,654 | |
Single Male w/Child | 69 | 458 | 1,447 | |
Single Female w/Child | 402 | 2,027 | 4,435 |
Population Change Last Two Decades - Plus Projection
2000 | % | 2010 | % | 2020 | % | 2030 | |
---|---|---|---|---|---|---|---|
New Jersey | 8,414,350 | +4 | 8,791,894 | +4 | 9,132,700 | +4 | 9,530,900 |
Burlington County | 423,394 | +6 | 448,734 | 0 | 450,000 | +3 | 464,900 |
Camden County | 508,932 | +1 | 513,657 | 0 | 511,800 | +2 | 521,000 |
Pennsylvania | 12,281,054 | +3 | 12,702,379 | +4 | 13,230,170 | +4 | 13,759,594 |
Bucks County | 597,635 | +5 | 625,249 | +1 | 629,420 | +1 | 637,730 |
Philadelphia County | 1,517,550 | +1 | 1,526,006 | +8 | 1,653,729 | +6 | 1,753,054 |
Total Working Age Population:
Total Households:
Total Working Age Population:
Total Households:
Total Working Age Population:
Total Households: