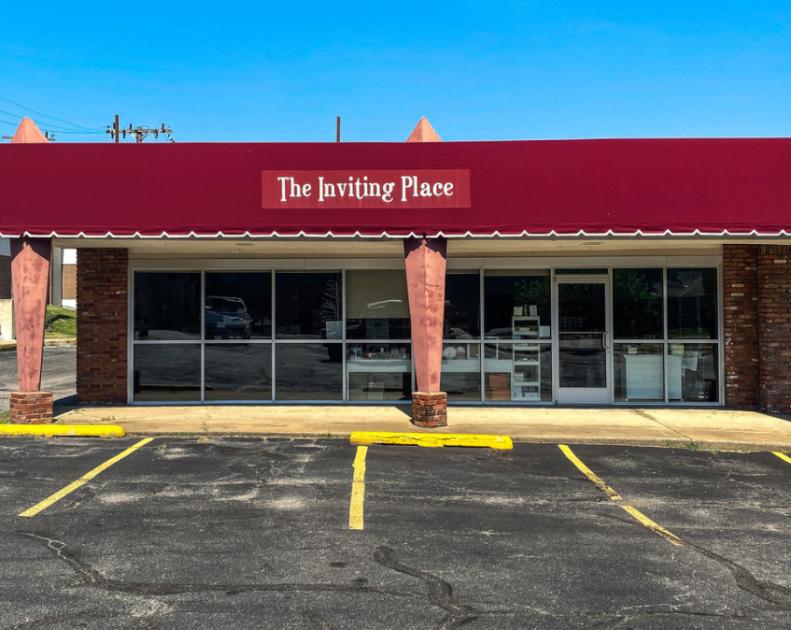
Retail Space
3533 South Harvard Avenue Tulsa, OK 74135
3533 South Harvard Avenue Tulsa, OK 74135
Details & Description
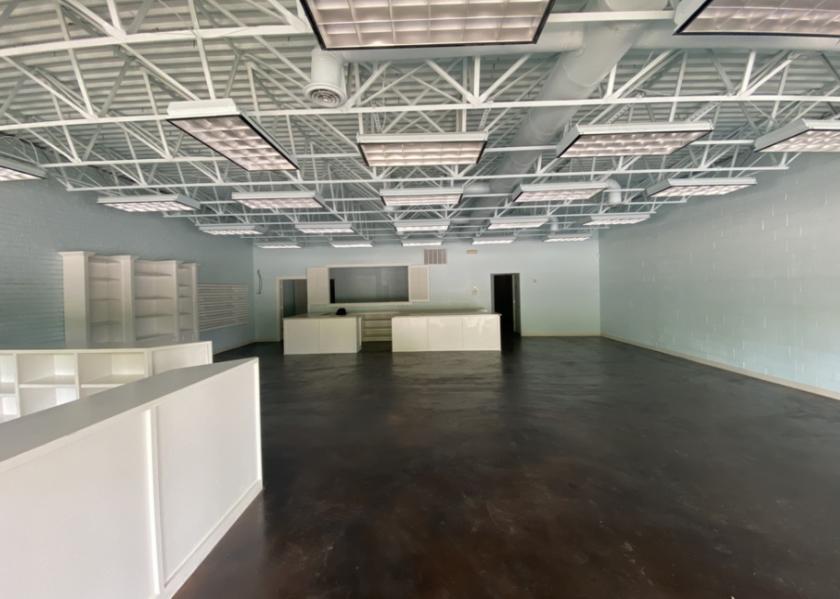
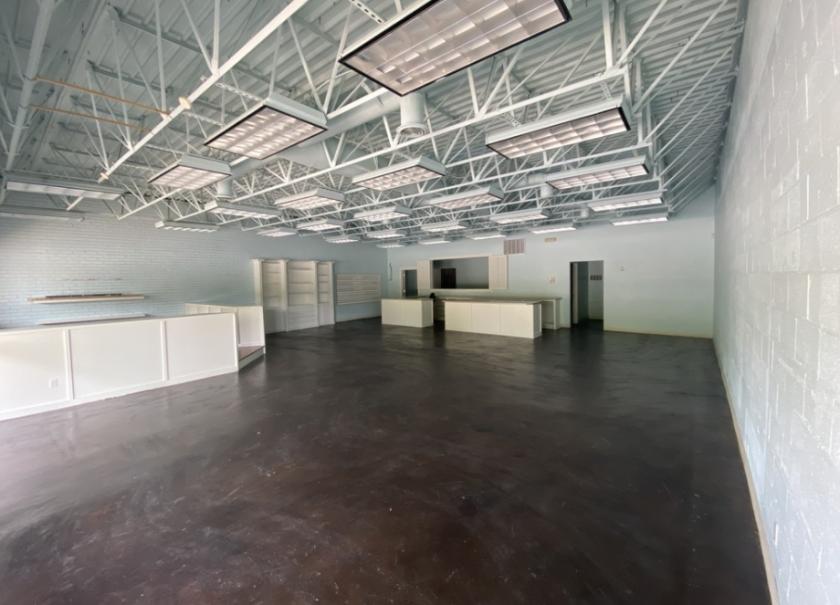
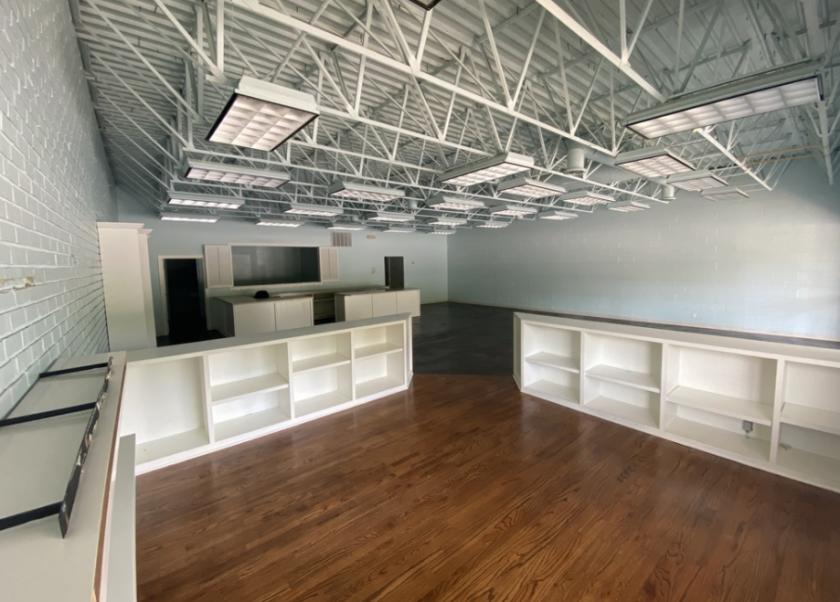
Additional Photos
Listing Agents

John Gray
O: 918-671-9997
jgray@mcgrawcp.com
O: 918-671-9997
jgray@mcgrawcp.com
While we strive to provide the most accurate information, all listing information, and demographic data, is provided by third-parties. As such, MyEListing will not be responsible for the accuracy of the information. It is strongly recommended that you verify all information with the listing agent, and any relevant agencies, prior to making any decisions.


