Retail Space
525 U.S. 46 Clifton, NJ 07013
525 U.S. 46 Clifton, NJ 07013
Details & Description
Property Highlights
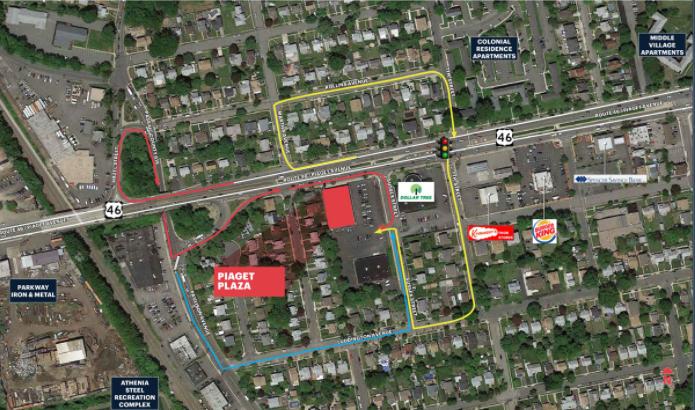
• Located on Main Street, just east of the Garden State Parkway and west of Route 20
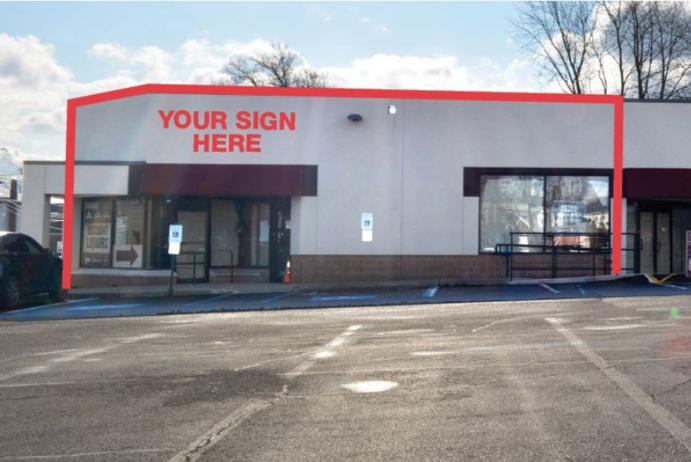
• Best signage in Clifton
Listing Agents

Florian Suserman
O: 201-777-2301
fsuserman@ripconj.com
O: 201-777-2301
fsuserman@ripconj.com
While we strive to provide the most accurate information, all listing information, and demographic data, is provided by third-parties. As such, MyEListing will not be responsible for the accuracy of the information. It is strongly recommended that you verify all information with the listing agent, and any relevant agencies, prior to making any decisions.