Office Space
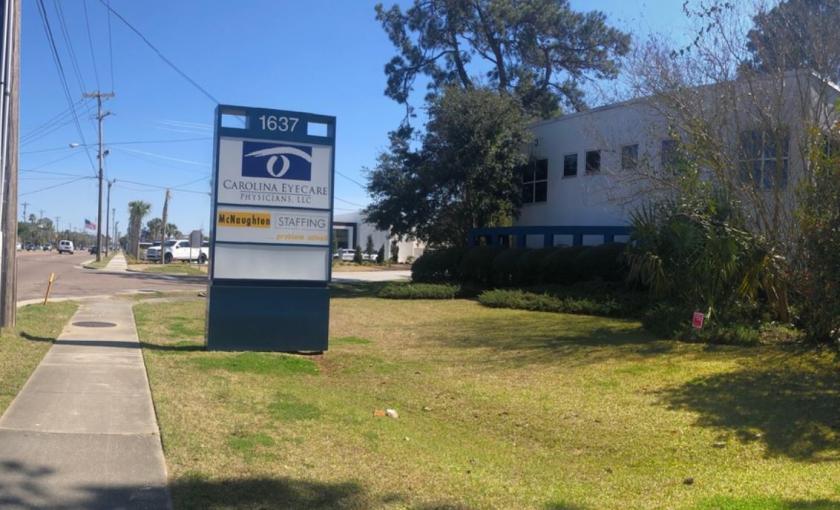
1637 Savannah Highway Charleston, SC 29407
1637 Savannah Highway Charleston, SC 29407
Details & Description
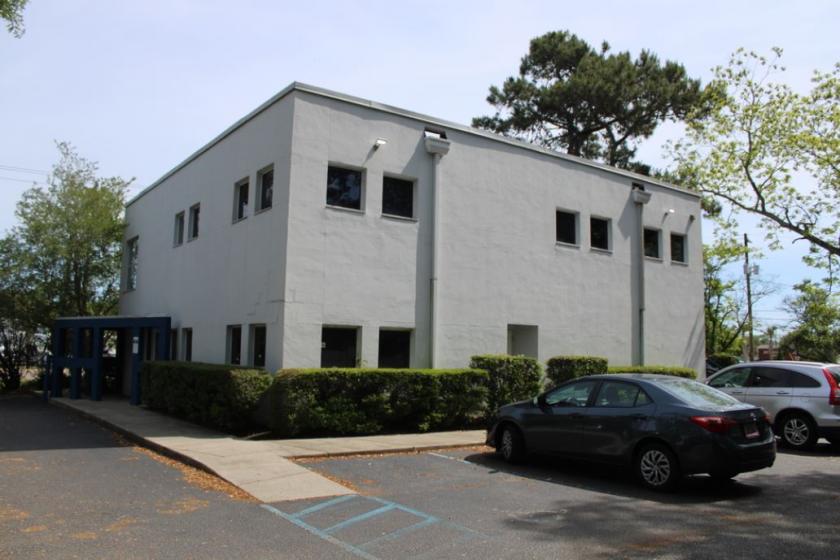
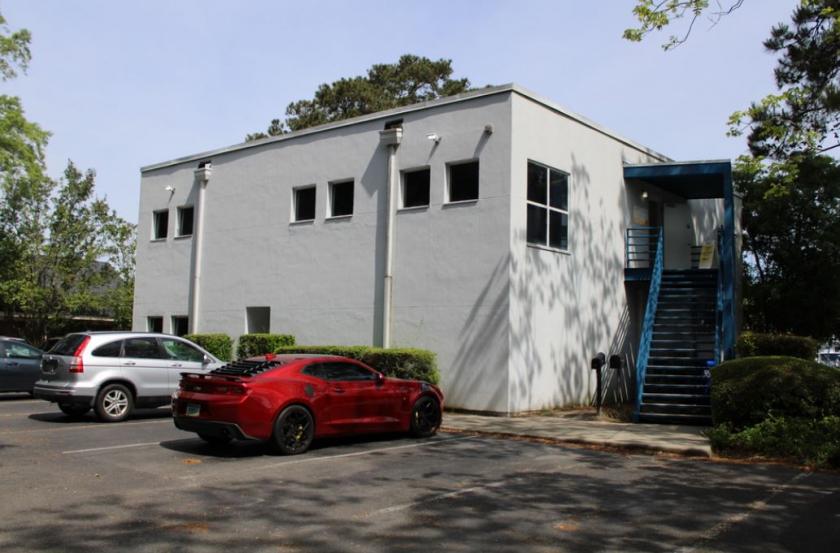
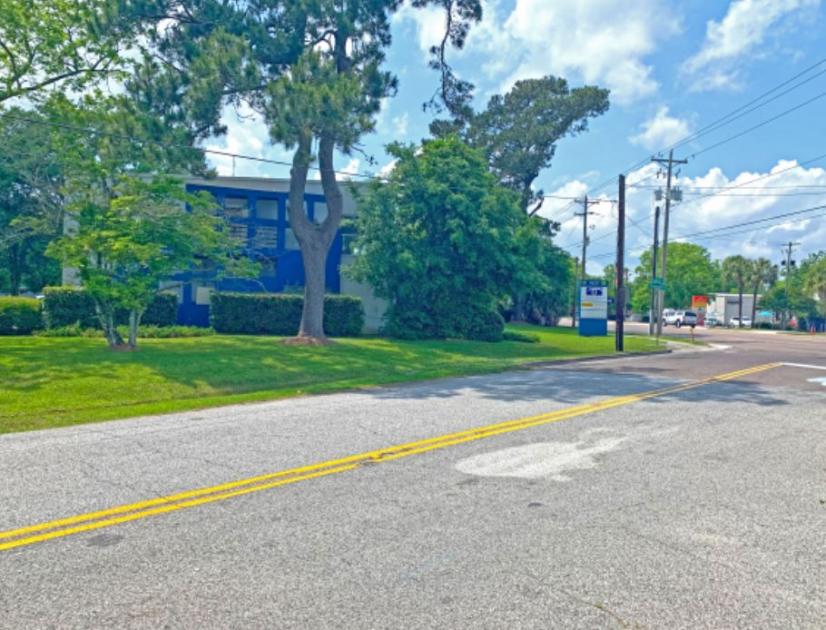
Additional Photos
Listing Agents

Weston Bradley
O: 843-203-1060
M: 757-373-3570
wbradley@lee-associates.com
O: 843-203-1060
M: 757-373-3570
wbradley@lee-associates.com
While we strive to provide the most accurate information, all listing information, and demographic data, is provided by third-parties. As such, MyEListing will not be responsible for the accuracy of the information. It is strongly recommended that you verify all information with the listing agent, and any relevant agencies, prior to making any decisions.


