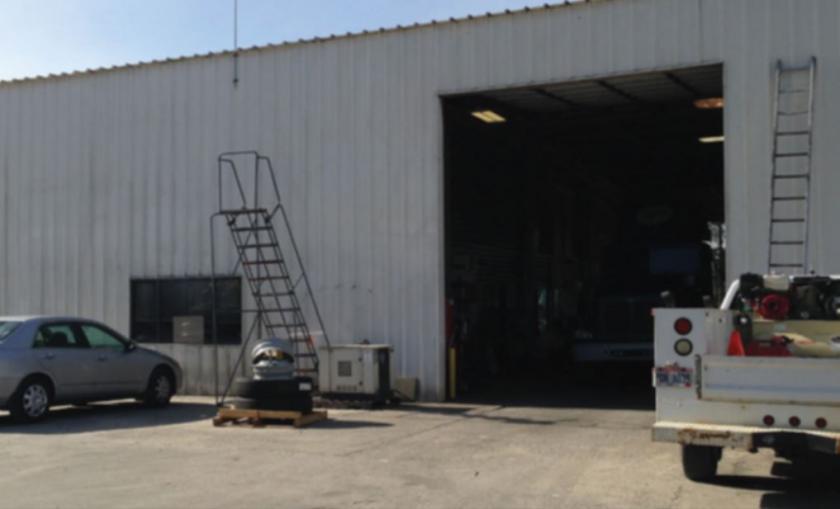
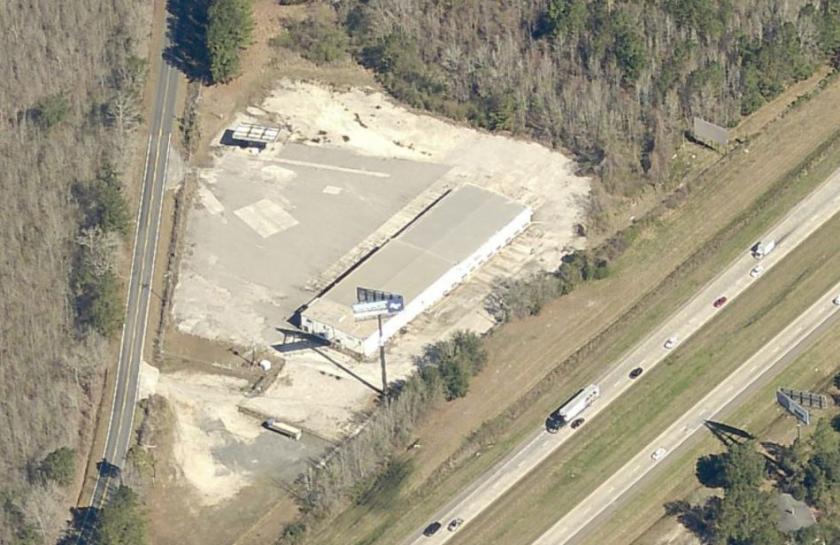
Single-tenant vacant 24,225 SF warehouse for sale sitting on 9.64 acres in Opportunity Zone in Hampton County (inside city limits of Yemassee). 18,952 SF of warehouse space and 5,273 SF of office space. This clear span warehouse features 35 cross-docks and one drive-in door. There is excess land available for automobile and truck parking. The office portion is two-stories tall; inquire with agents for dimension details. The property is zoned office commercial district (Town of Yemassee) which permits a wide variety of residential and commercial uses. Prior tenant used the space for distribution. Fully fenced yard composed of paved asphalt. The warehouse is located in flood zone X- minimal (area of minimal flood hazard, usually depicted on FIRMs as above the 500-year flood level). The site is located in a SC Promise Zone (federal grant program for employed citizens). Taxes were 62 cents per SF in 2019. The land use and improvement type is commercial warehouse. This site has a private well and septic system (Lowcountry regional water systems; lines are both 3,500’ from site; well is rates 150,000 GPD capacity). The site has natural gas provided by Dominion Energy. Dominion Energy is also the electricity provider (23kC distribution; 115kV transmission). The telecommunications provider is Century Link/Hargray. Ownership of two billboards on premise will remain with current owner. The property is also for lease.*The information contained herein has been obtained through sources deemed reliable but cannot be guaranteed as to its accuracy. Any information of special interest should be obtained through independent verification.*