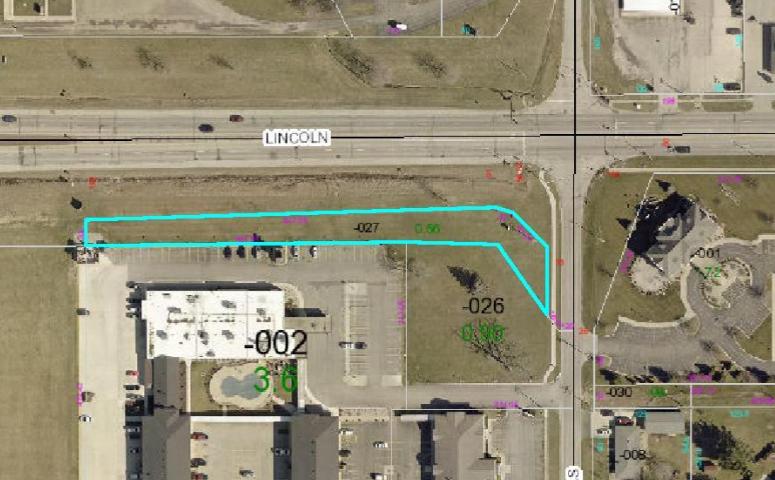
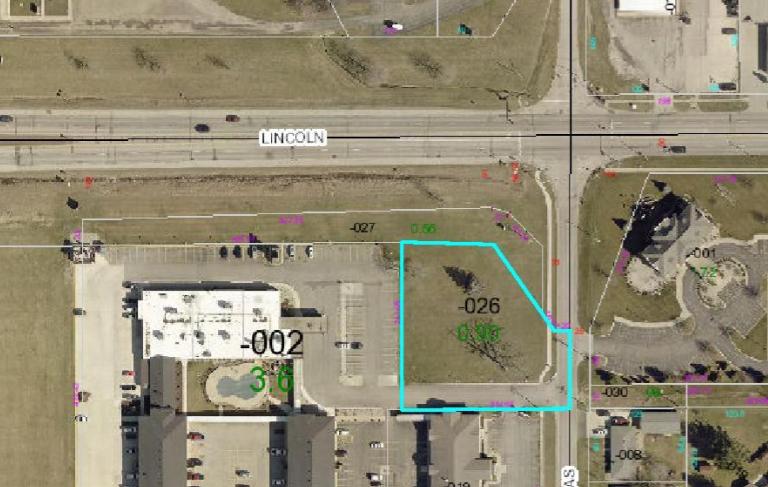
1-Mile | 3-Miles | 5-Miles | ||
---|---|---|---|---|
Total Population | 4,136 | 20,646 | 23,910 | |
Population Median Age | 36 | 35 | 35 | |
Population by Age | 0-9 Yrs | 477 (11%) | 1770 (8%) | 2044 (8%) |
10-19 Yrs | 408 (9%) | 3296 (15%) | 3678 (15%) | |
20-29 Yrs | 1184 (28%) | 5702 (27%) | 6642 (27%) | |
30-39 Yrs | 624 (15%) | 2546 (12%) | 2872 (12%) | |
40-49 Yrs | 277 (6%) | 1894 (9%) | 2222 (9%) | |
50-59 Yrs | 359 (8%) | 2133 (10%) | 2510 (10%) | |
60-69 Yrs | 398 (9%) | 1695 (8%) | 1980 (8%) | |
70+ Yrs | 407 (9%) | 1610 (7%) | 1962 (8%) | |
Median HH Income | $39,393 | $44,491 | $44,513 | |
Total Household Income | < 24K | 554 (31%) | 2353 (30%) | 2900 (31%) |
25-49K | 528 (29%) | 1863 (23%) | 2074 (22%) | |
50-74K | 261 (14%) | 1349 (17%) | 1566 (17%) | |
75-99K | 126 (7%) | 705 (9%) | 868 (9%) | |
100-199K | 249 (14%) | 1243 (15%) | 1474 (16%) | |
200K+ | 56 (3%) | 274 (3%) | 310 (3%) | |
Highest Education Level | No Diploma | 153 | 866 | 1026 |
Diploma or GED | 477 | 2788 | 3342 | |
Some College | 671 | 2618 | 2917 | |
Assoc. Degree | 185 | 1248 | 1412 | |
Bachelors Degree | 552 | 2226 | 2619 | |
Higher Degree | 486 | 1771 | 2109 | |
Total Housing Units | 2,083 | 9,082 | 10,698 | |
--Owner-Occupied | 860 | 4,156 | 4,849 | |
--Renter-Occupied | 914 | 3,631 | 4,342 | |
Owner-Occupied Values | < 100K | 365 | 1759 | 2032 |
100-199K | 336 | 1694 | 1960 | |
200-299K | 83 | 427 | 532 | |
300-399K | 46 | 192 | 222 | |
400-499K | 12 | 37 | 44 | |
500K+ | 17 | 47 | 59 | |
Total Working Age Population | 3,463 | 17,877 | 20,643 | |
In Work Force | 2,211 | 11,041 | 12,730 | |
Not In Work Force | 1,252 | 6,836 | 7,913 | |
Workforce Employed | 2,067 | 10,441 | 12,036 | |
Workforce Unemployed | 144 | 586 | 681 | |
Civlian Workforce | 2,211 | 11,028 | 12,717 | |
Military Workforce | 0 | 13 | 13 | |
Total Households | 1,774 | 7,787 | 9,191 | |
Family Households | 963 | 4,076 | 4,736 | |
Non-Family Households | 811 | 3,711 | 4,455 | |
Married Couple | 683 | 2,825 | 3,300 | |
Other Family | 281 | 1,251 | 1,437 | |
Married w/Child | 260 | 1,016 | 1,199 | |
Single Male w/Child | 12 | 123 | 132 | |
Single Female w/Child | 171 | 514 | 564 |
Population Change Last Two Decades - Plus Projection
2000 | % | 2010 | % | 2020 | % | 2030 | |
---|---|---|---|---|---|---|---|
Illinois | 12,419,293 | +3 | 12,830,632 | +12 | 14,316,487 | +6 | 15,138,849 |
Coles County | 53,196 | +1 | 53,873 | +8 | 58,030 | +3 | 59,746 |
Total Working Age Population:
Total Households:
Total Working Age Population:
Total Households:
Total Working Age Population:
Total Households: