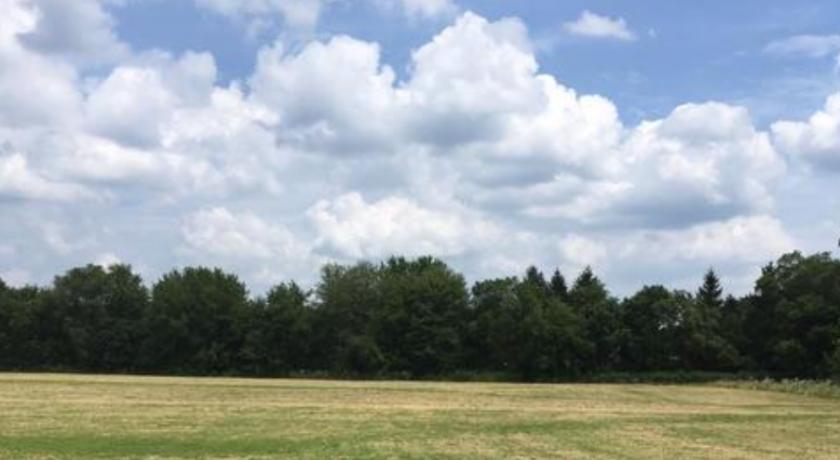
1-Mile | 3-Miles | 5-Miles | ||
---|---|---|---|---|
Total Population | 3,392 | 29,724 | 79,708 | |
Population Median Age | 39 | 40 | 39 | |
Population by Age | 0-9 Yrs | 337 (9%) | 2891 (9%) | 9469 (11%) |
10-19 Yrs | 605 (17%) | 4261 (14%) | 10305 (12%) | |
20-29 Yrs | 295 (8%) | 3563 (11%) | 10600 (13%) | |
30-39 Yrs | 496 (14%) | 3604 (12%) | 9656 (12%) | |
40-49 Yrs | 401 (11%) | 3865 (13%) | 10369 (13%) | |
50-59 Yrs | 559 (16%) | 5320 (17%) | 12890 (16%) | |
60-69 Yrs | 299 (8%) | 3420 (11%) | 9197 (11%) | |
70+ Yrs | 402 (11%) | 2799 (9%) | 7224 (9%) | |
Median HH Income | $102,119 | $81,138 | $72,548 | |
Total Household Income | < 24K | 127 (10%) | 1290 (11%) | 3916 (12%) |
25-49K | 151 (12%) | 1950 (16%) | 6271 (20%) | |
50-74K | 175 (14%) | 2105 (18%) | 5713 (18%) | |
75-99K | 130 (10%) | 1708 (14%) | 4372 (14%) | |
100-199K | 490 (41%) | 3562 (30%) | 8475 (27%) | |
200K+ | 117 (9%) | 914 (7%) | 2038 (6%) | |
Highest Education Level | No Diploma | 155 | 1247 | 4394 |
Diploma or GED | 734 | 7241 | 17782 | |
Some College | 513 | 4825 | 12838 | |
Assoc. Degree | 170 | 1636 | 4934 | |
Bachelors Degree | 517 | 4256 | 10763 | |
Higher Degree | 189 | 1564 | 4343 | |
Total Housing Units | 1,337 | 12,599 | 34,263 | |
--Owner-Occupied | 1,004 | 8,756 | 22,843 | |
--Renter-Occupied | 186 | 2,775 | 7,942 | |
Owner-Occupied Values | < 100K | 23 | 703 | 2299 |
100-199K | 226 | 3620 | 10624 | |
200-299K | 383 | 2548 | 6117 | |
300-399K | 175 | 998 | 2247 | |
400-499K | 84 | 481 | 815 | |
500K+ | 112 | 406 | 741 | |
Total Working Age Population | 2,687 | 24,418 | 64,142 | |
In Work Force | 1,810 | 17,029 | 44,073 | |
Not In Work Force | 877 | 7,389 | 20,069 | |
Workforce Employed | 1,707 | 16,311 | 42,018 | |
Workforce Unemployed | 103 | 718 | 2,035 | |
Civlian Workforce | 1,810 | 17,029 | 44,053 | |
Military Workforce | 0 | 0 | 20 | |
Total Households | 1,190 | 11,531 | 30,784 | |
Family Households | 893 | 8,036 | 20,530 | |
Non-Family Households | 297 | 3,495 | 10,254 | |
Married Couple | 719 | 6,268 | 15,711 | |
Other Family | 173 | 1,768 | 4,819 | |
Married w/Child | 343 | 2,278 | 5,987 | |
Single Male w/Child | 13 | 281 | 838 | |
Single Female w/Child | 75 | 714 | 1,848 |
Population Change Last Two Decades - Plus Projection
2000 | % | 2010 | % | 2020 | % | 2030 | |
---|---|---|---|---|---|---|---|
Illinois | 12,419,293 | +3 | 12,830,632 | +12 | 14,316,487 | +6 | 15,138,849 |
Lake County | 644,356 | +9 | 703,462 | +17 | 820,250 | +6 | 873,024 |
McHenry County | 260,077 | +19 | 308,760 | +32 | 407,931 | +9 | 443,398 |
Total Working Age Population:
Total Households:
Total Working Age Population:
Total Households:
Total Working Age Population:
Total Households: