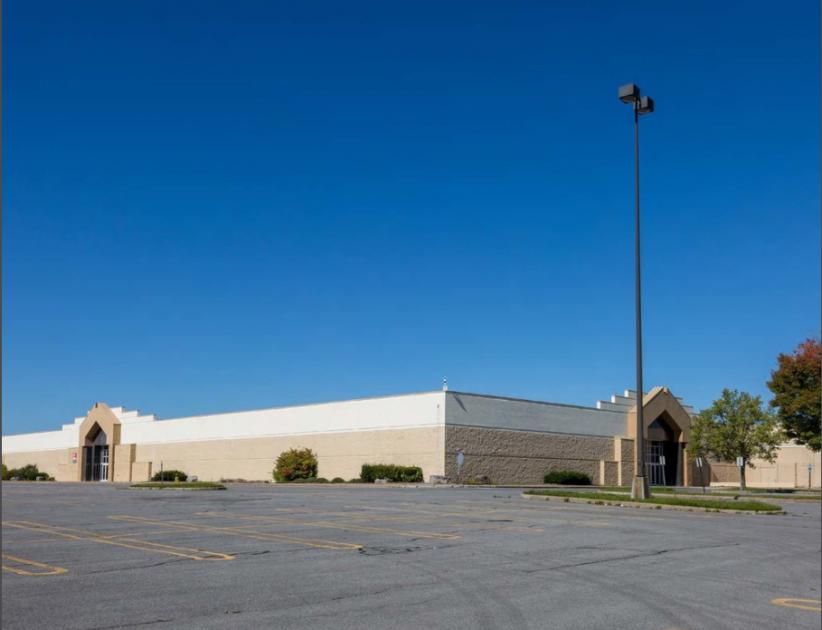
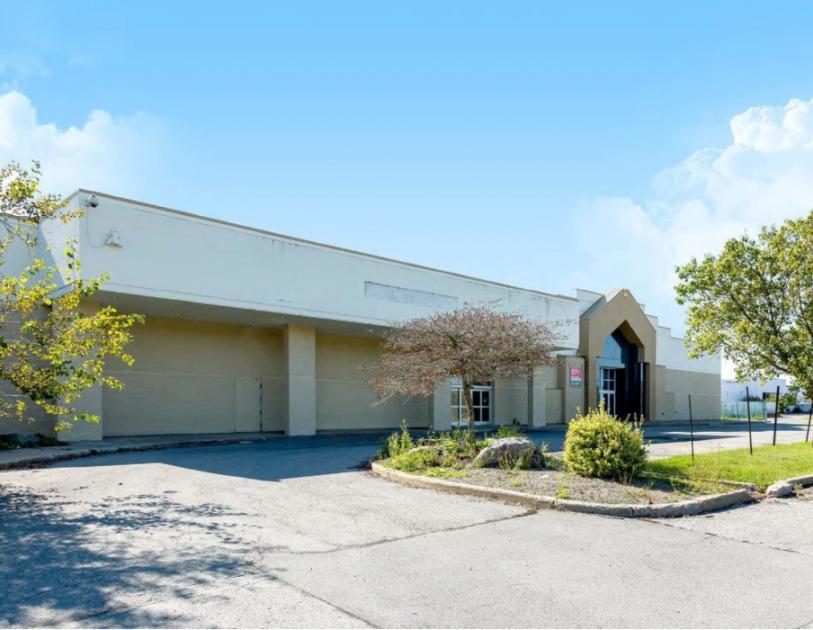
Retail Space
4155 New York 31 Clay, NY 13041
4155 New York 31 Clay, NY 13041
Details & Description
Property Highlights
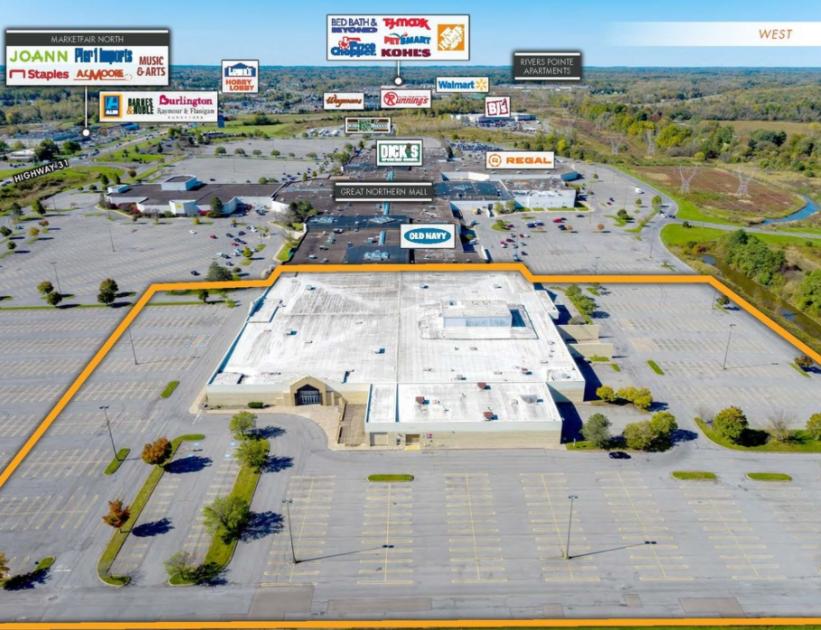
- • Strong Retail Corridor
- • UpsideRedevelopment Opportunity
- • Additional Outparcel Opportunity
- • Exceptional Demographics
Listing Agents

Lynn DeMarco
O: 212-741-2500
lynn.demarco@tscg.com
O: 212-741-2500
lynn.demarco@tscg.com
While we strive to provide the most accurate information, all listing information, and demographic data, is provided by third-parties. As such, MyEListing will not be responsible for the accuracy of the information. It is strongly recommended that you verify all information with the listing agent, and any relevant agencies, prior to making any decisions.