Retail Space
5900- Rivers Avenue North Charleston, SC 29406
5900- Rivers Avenue North Charleston, SC 29406
Details & Description
Property Highlights
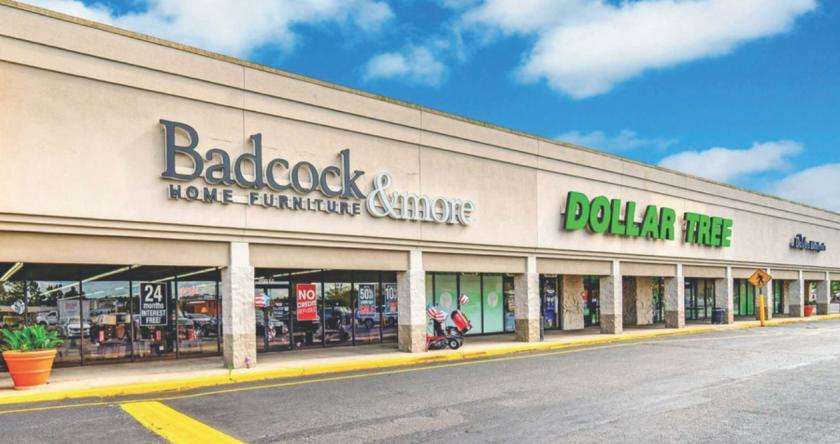
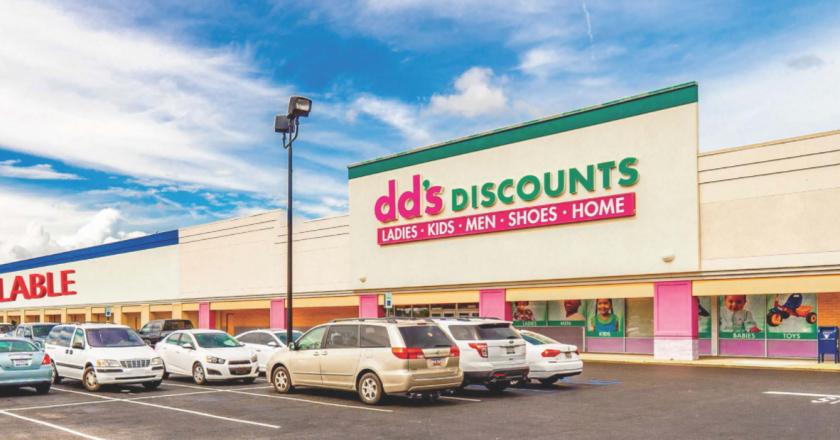
• Anchor Northern Tool, Badcock Furniture, dds Discounts, and Dollar Tree
• Traffic Count Rivers Ave - 33,600 AADT Aviation Ave - 19,900 AADT
Listing Agents

Jeff Yurfest
O: 843-723-3054
jeff.yurfest@tscg.com
O: 843-723-3054
jeff.yurfest@tscg.com
While we strive to provide the most accurate information, all listing information, and demographic data, is provided by third-parties. As such, MyEListing will not be responsible for the accuracy of the information. It is strongly recommended that you verify all information with the listing agent, and any relevant agencies, prior to making any decisions.