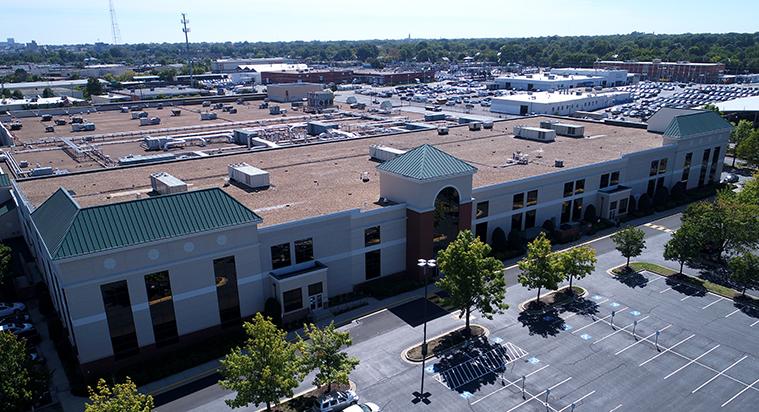
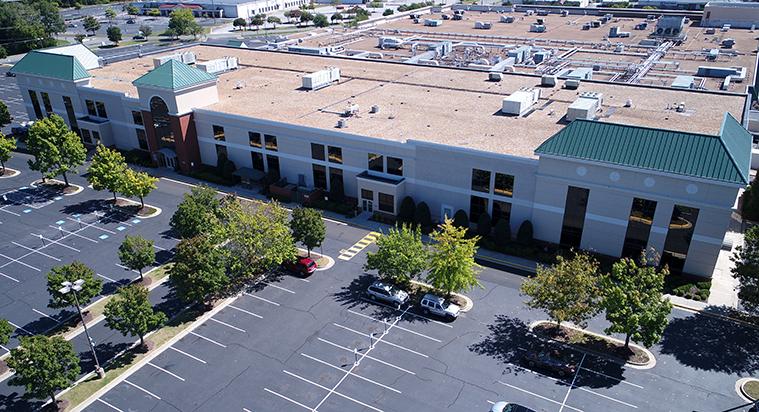
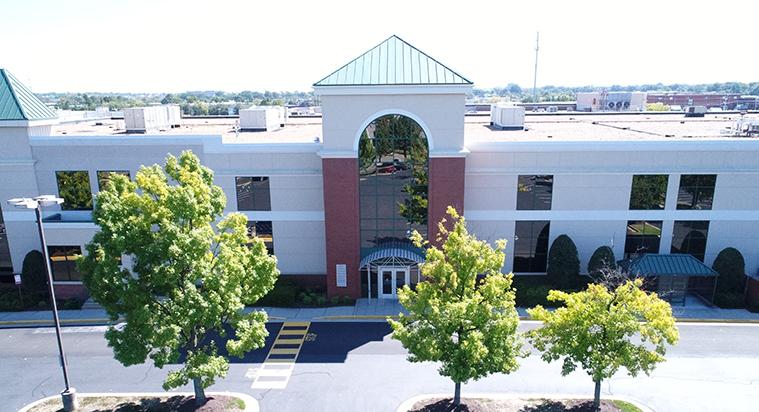
1-Mile | 3-Miles | 5-Miles | ||
---|---|---|---|---|
Total Population | 6,705 | 100,744 | 257,988 | |
Population Median Age | 44 | 39 | 38 | |
Population by Age | 0-9 Yrs | 717 (10%) | 8680 (8%) | 25459 (9%) |
10-19 Yrs | 386 (5%) | 9901 (9%) | 28330 (10%) | |
20-29 Yrs | 773 (11%) | 20435 (20%) | 52161 (20%) | |
30-39 Yrs | 1305 (19%) | 17111 (16%) | 41208 (15%) | |
40-49 Yrs | 744 (11%) | 10972 (10%) | 28504 (11%) | |
50-59 Yrs | 725 (10%) | 11799 (11%) | 31382 (12%) | |
60-69 Yrs | 969 (14%) | 11009 (10%) | 26911 (10%) | |
70+ Yrs | 1085 (16%) | 10837 (10%) | 24033 (9%) | |
Median HH Income | $74,446 | $64,772 | $55,797 | |
Total Household Income | < 24K | 682 (20%) | 8188 (18%) | 24016 (22%) |
25-49K | 547 (16%) | 9413 (21%) | 24995 (23%) | |
50-74K | 431 (13%) | 6757 (15%) | 18154 (16%) | |
75-99K | 465 (14%) | 4744 (10%) | 12011 (11%) | |
100-199K | 834 (25%) | 9845 (22%) | 20359 (18%) | |
200K+ | 340 (10%) | 4630 (10%) | 7749 (7%) | |
Highest Education Level | No Diploma | 317 | 5896 | 18194 |
Diploma or GED | 712 | 11203 | 35288 | |
Some College | 865 | 11753 | 34286 | |
Assoc. Degree | 264 | 3351 | 10781 | |
Bachelors Degree | 1904 | 24582 | 49903 | |
Higher Degree | 1328 | 16734 | 33287 | |
Total Housing Units | 3,488 | 47,732 | 117,198 | |
--Owner-Occupied | 2,098 | 22,821 | 52,397 | |
--Renter-Occupied | 1,200 | 20,755 | 54,887 | |
Owner-Occupied Values | < 100K | 21 | 893 | 3423 |
100-199K | 429 | 5218 | 15944 | |
200-299K | 619 | 5836 | 14830 | |
300-399K | 463 | 3787 | 7221 | |
400-499K | 300 | 2229 | 3691 | |
500K+ | 267 | 4858 | 7288 | |
Total Working Age Population | 5,740 | 87,213 | 218,233 | |
In Work Force | 3,867 | 61,386 | 150,042 | |
Not In Work Force | 1,873 | 25,827 | 68,192 | |
Workforce Employed | 3,778 | 58,220 | 141,069 | |
Workforce Unemployed | 89 | 2,903 | 8,321 | |
Civlian Workforce | 3,867 | 61,124 | 149,390 | |
Military Workforce | 0 | 263 | 652 | |
Total Households | 3,298 | 43,576 | 107,284 | |
Family Households | 1,318 | 19,573 | 50,881 | |
Non-Family Households | 1,980 | 24,003 | 56,403 | |
Married Couple | 1,108 | 14,321 | 33,008 | |
Other Family | 210 | 5,253 | 17,874 | |
Married w/Child | 456 | 5,211 | 11,468 | |
Single Male w/Child | 21 | 495 | 1,623 | |
Single Female w/Child | 54 | 1,737 | 6,899 |
Population Change Last Two Decades - Plus Projection
2000 | % | 2010 | % | 2020 | % | 2030 | |
---|---|---|---|---|---|---|---|
Virginia | 7,078,515 | +13 | 8,001,024 | +8 | 8,655,021 | +8 | 9,331,666 |
Chesterfield County | 259,903 | +22 | 316,236 | +12 | 353,841 | +12 | 396,647 |
Hanover County | 86,320 | +16 | 99,863 | +9 | 109,244 | +9 | 119,360 |
Henrico County | 262,300 | +17 | 306,935 | +8 | 332,103 | +9 | 363,259 |
Richmond city | 197,790 | +3 | 204,214 | +14 | 232,533 | +6 | 245,483 |
Total Working Age Population:
Total Households:
Total Working Age Population:
Total Households:
Total Working Age Population:
Total Households: