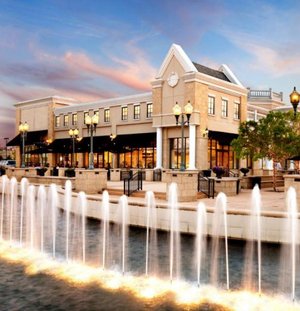
1-Mile | 3-Miles | 5-Miles | ||
---|---|---|---|---|
Total Population | 4,009 | 62,097 | 176,731 | |
Population Median Age | 37 | 36 | 36 | |
Population by Age | 0-9 Yrs | 651 (16%) | 8865 (14%) | 25533 (14%) |
10-19 Yrs | 440 (10%) | 7232 (11%) | 21421 (12%) | |
20-29 Yrs | 598 (14%) | 8828 (14%) | 22823 (12%) | |
30-39 Yrs | 589 (14%) | 10515 (16%) | 29325 (16%) | |
40-49 Yrs | 558 (13%) | 9574 (15%) | 26996 (15%) | |
50-59 Yrs | 315 (7%) | 7346 (11%) | 21360 (12%) | |
60-69 Yrs | 401 (10%) | 4738 (7%) | 15285 (8%) | |
70+ Yrs | 457 (11%) | 4998 (8%) | 13988 (7%) | |
Median HH Income | $55,952 | $65,114 | $79,133 | |
Total Household Income | < 24K | 313 (19%) | 3726 (15%) | 8091 (11%) |
25-49K | 398 (25%) | 5842 (23%) | 12759 (18%) | |
50-74K | 408 (25%) | 4559 (18%) | 11547 (16%) | |
75-99K | 183 (11%) | 3570 (14%) | 9739 (14%) | |
100-199K | 225 (14%) | 5191 (20%) | 17509 (25%) | |
200K+ | 61 (3%) | 1918 (7%) | 8370 (12%) | |
Highest Education Level | No Diploma | 229 | 3334 | 9770 |
Diploma or GED | 565 | 8185 | 19290 | |
Some College | 584 | 8238 | 21922 | |
Assoc. Degree | 232 | 3570 | 9028 | |
Bachelors Degree | 806 | 13248 | 39738 | |
Higher Degree | 252 | 5912 | 21147 | |
Total Housing Units | 1,830 | 26,642 | 72,446 | |
--Owner-Occupied | 680 | 13,135 | 40,758 | |
--Renter-Occupied | 907 | 11,670 | 27,257 | |
Owner-Occupied Values | < 100K | 45 | 1300 | 2500 |
100-199K | 373 | 4160 | 9508 | |
200-299K | 200 | 3639 | 9990 | |
300-399K | 19 | 1784 | 7275 | |
400-499K | 26 | 1208 | 4723 | |
500K+ | 17 | 1045 | 6762 | |
Total Working Age Population | 3,070 | 48,646 | 136,871 | |
In Work Force | 2,147 | 36,118 | 100,171 | |
Not In Work Force | 923 | 12,528 | 36,700 | |
Workforce Employed | 2,088 | 34,634 | 96,094 | |
Workforce Unemployed | 58 | 1,411 | 3,964 | |
Civlian Workforce | 2,145 | 36,045 | 100,058 | |
Military Workforce | 2 | 73 | 113 | |
Total Households | 1,587 | 24,805 | 68,015 | |
Family Households | 846 | 14,474 | 43,227 | |
Non-Family Households | 740 | 10,332 | 24,788 | |
Married Couple | 551 | 9,981 | 32,297 | |
Other Family | 296 | 4,493 | 10,930 | |
Married w/Child | 246 | 4,542 | 15,241 | |
Single Male w/Child | 31 | 728 | 1,649 | |
Single Female w/Child | 205 | 2,039 | 4,597 |
Population Change Last Two Decades - Plus Projection
2000 | % | 2010 | % | 2020 | % | 2030 | |
---|---|---|---|---|---|---|---|
North Carolina | 8,049,313 | +18 | 9,535,483 | +11 | 10,630,691 | +11 | 11,836,070 |
Gaston County | 190,365 | +8 | 206,086 | +9 | 223,842 | +7 | 239,285 |
Mecklenburg County | 695,454 | +32 | 919,628 | +23 | 1,131,342 | +19 | 1,348,822 |
Union County | 123,677 | +63 | 201,292 | +21 | 242,657 | +25 | 302,410 |
South Carolina | 4,012,012 | +15 | 4,625,364 | +9 | 5,020,400 | +9 | 5,488,460 |
Lancaster County | 61,351 | +25 | 76,652 | +4 | 79,480 | +6 | 83,940 |
York County | 164,614 | +37 | 226,073 | +12 | 252,860 | +14 | 287,970 |
Total Working Age Population:
Total Households:
Total Working Age Population:
Total Households:
Total Working Age Population:
Total Households: