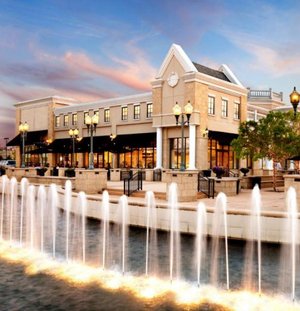
Retail Space
8021 Concord Mills Boulevard Concord, NC 28027
8021 Concord Mills Boulevard Concord, NC 28027
Details & Description
Property Highlights
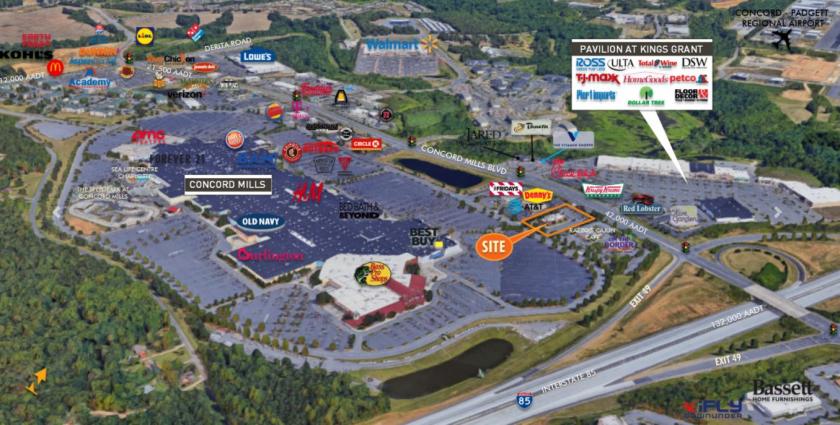
• Located at the front of Concord Mills at the new flyover entrance to the mall
• Over 17 million visitors per year visit Concord Mills Mall
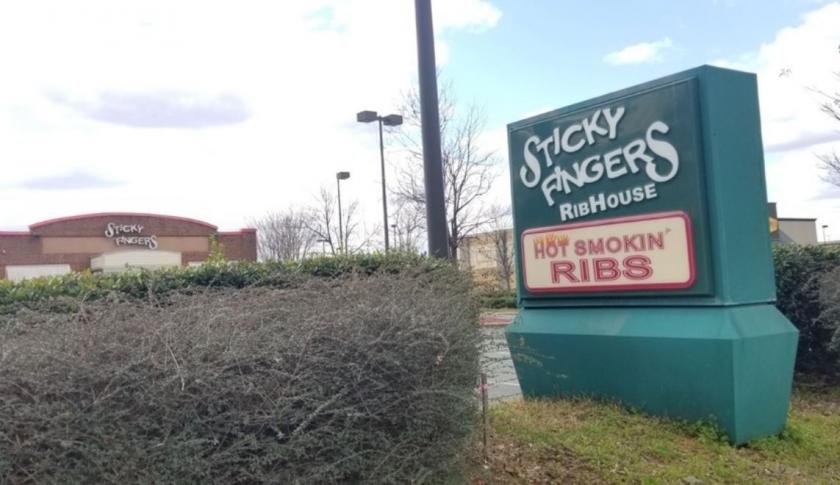
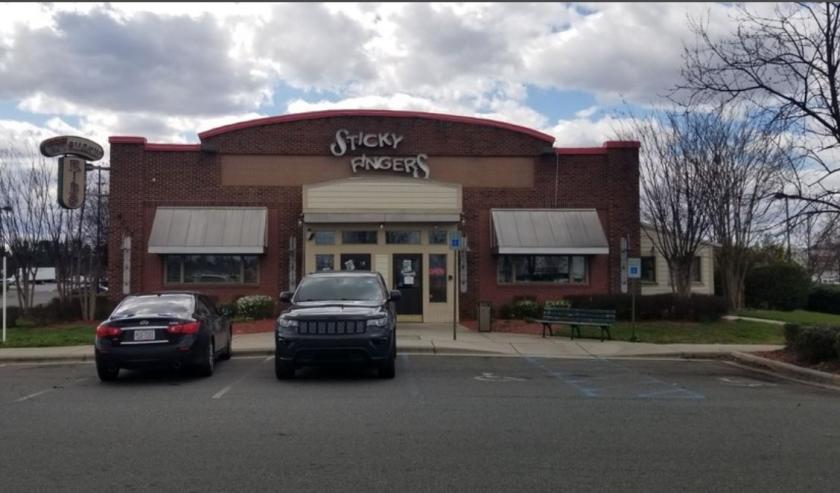
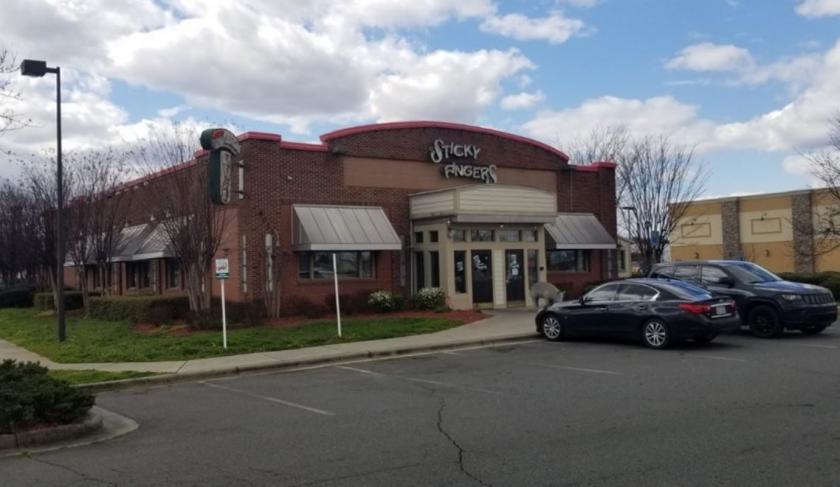
Additional Photos
Listing Agents

Darrell Palasciano
O: 704-644-4587
dpalasciano@providencegroup.com
O: 704-644-4587
dpalasciano@providencegroup.com
While we strive to provide the most accurate information, all listing information, and demographic data, is provided by third-parties. As such, MyEListing will not be responsible for the accuracy of the information. It is strongly recommended that you verify all information with the listing agent, and any relevant agencies, prior to making any decisions.