Commercial Land
100 Spring Street Nashville, TN 37207
100 Spring Street Nashville, TN 37207
Details & Description
Property Highlights
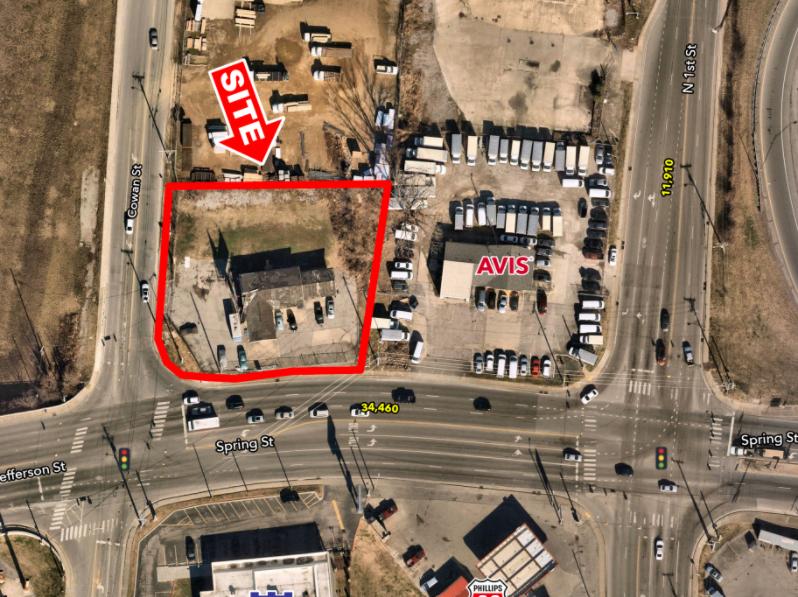
• Positioned the signalized intersection of Spring Jefferson Street and Cowan Street
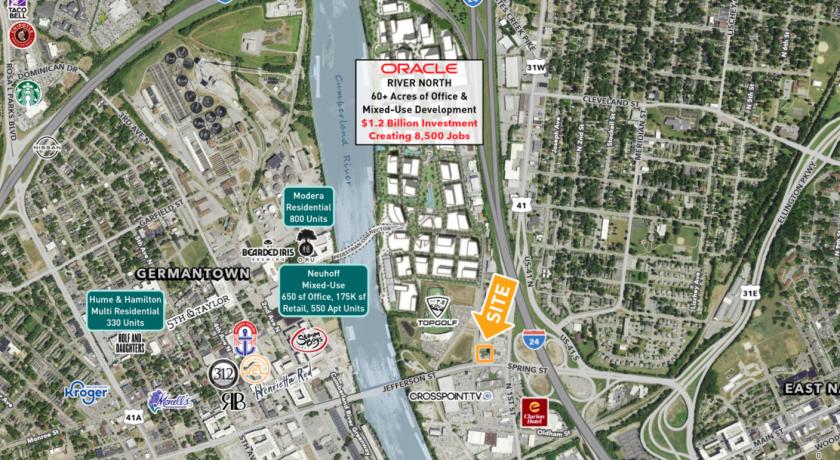
• Highly visible and located directly across the street from TopGolf
Listing Agents

Chris Caldwell
O: 615-259-0200
chris.caldwell@tscg.com
O: 615-259-0200
chris.caldwell@tscg.com
While we strive to provide the most accurate information, all listing information, and demographic data, is provided by third-parties. As such, MyEListing will not be responsible for the accuracy of the information. It is strongly recommended that you verify all information with the listing agent, and any relevant agencies, prior to making any decisions.