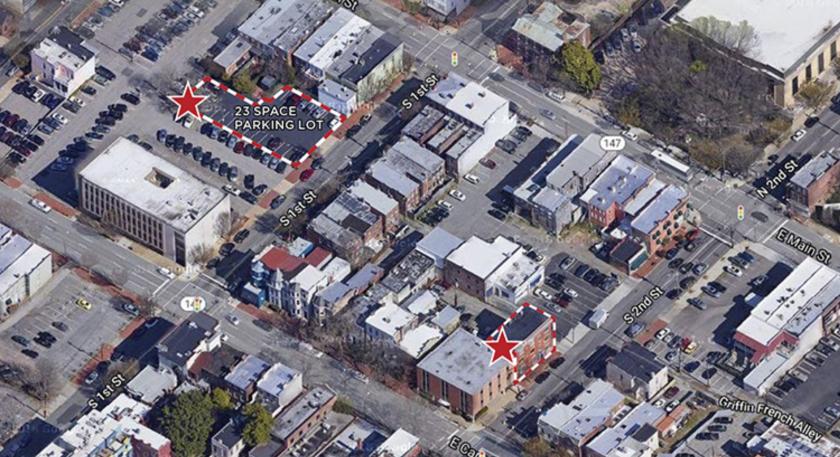
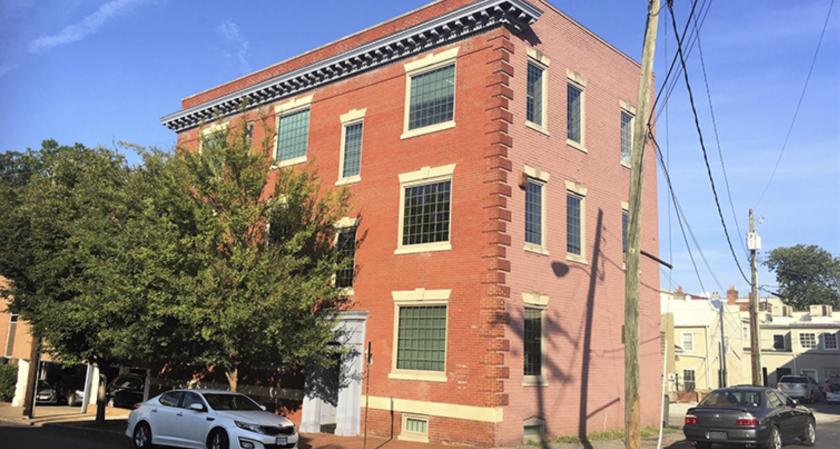
1-Mile | 3-Miles | 5-Miles | ||
---|---|---|---|---|
Total Population | 21,989 | 137,461 | 259,941 | |
Population Median Age | 30 | 36 | 38 | |
Population by Age | 0-9 Yrs | 1147 (5%) | 12308 (8%) | 28310 (10%) |
10-19 Yrs | 4424 (20%) | 14553 (10%) | 27466 (10%) | |
20-29 Yrs | 9242 (42%) | 35393 (25%) | 51957 (19%) | |
30-39 Yrs | 2496 (11%) | 22635 (16%) | 40978 (15%) | |
40-49 Yrs | 1439 (6%) | 13556 (9%) | 28203 (10%) | |
50-59 Yrs | 1404 (6%) | 16021 (11%) | 32727 (12%) | |
60-69 Yrs | 1147 (5%) | 13356 (9%) | 27143 (10%) | |
70+ Yrs | 691 (3%) | 9638 (7%) | 23158 (8%) | |
Median HH Income | $33,306 | $44,803 | $47,247 | |
Total Household Income | < 24K | 3711 (42%) | 17614 (31%) | 30158 (28%) |
25-49K | 1812 (20%) | 12936 (22%) | 25615 (24%) | |
50-74K | 1437 (16%) | 9394 (16%) | 17949 (16%) | |
75-99K | 828 (9%) | 5573 (9%) | 11087 (10%) | |
100-199K | 691 (7%) | 8119 (14%) | 15702 (14%) | |
200K+ | 337 (3%) | 2934 (5%) | 5815 (5%) | |
Highest Education Level | No Diploma | 1101 | 11991 | 24890 |
Diploma or GED | 1643 | 19844 | 42693 | |
Some College | 1614 | 17549 | 35137 | |
Assoc. Degree | 573 | 5134 | 11124 | |
Bachelors Degree | 3385 | 24515 | 41375 | |
Higher Degree | 2295 | 15638 | 26724 | |
Total Housing Units | 9,872 | 63,798 | 117,708 | |
--Owner-Occupied | 1,479 | 20,660 | 47,154 | |
--Renter-Occupied | 7,337 | 35,909 | 59,172 | |
Owner-Occupied Values | < 100K | 123 | 3318 | 6665 |
100-199K | 491 | 6093 | 17506 | |
200-299K | 348 | 4021 | 9549 | |
300-399K | 155 | 2903 | 5283 | |
400-499K | 171 | 1693 | 2766 | |
500K+ | 191 | 2634 | 5387 | |
Total Working Age Population | 20,321 | 118,595 | 217,221 | |
In Work Force | 12,922 | 79,499 | 144,771 | |
Not In Work Force | 7,399 | 39,096 | 72,451 | |
Workforce Employed | 11,470 | 74,188 | 135,043 | |
Workforce Unemployed | 1,345 | 4,813 | 9,082 | |
Civlian Workforce | 12,816 | 79,000 | 144,125 | |
Military Workforce | 106 | 498 | 646 | |
Total Households | 8,816 | 56,569 | 106,326 | |
Family Households | 1,992 | 21,660 | 48,034 | |
Non-Family Households | 6,824 | 34,909 | 58,293 | |
Married Couple | 999 | 11,358 | 26,299 | |
Other Family | 994 | 10,302 | 21,734 | |
Married w/Child | 146 | 3,034 | 8,361 | |
Single Male w/Child | 38 | 661 | 1,609 | |
Single Female w/Child | 496 | 4,307 | 8,721 |
Population Change Last Two Decades - Plus Projection
2000 | % | 2010 | % | 2020 | % | 2030 | |
---|---|---|---|---|---|---|---|
Virginia | 7,078,515 | +13 | 8,001,024 | +8 | 8,655,021 | +8 | 9,331,666 |
Chesterfield County | 259,903 | +22 | 316,236 | +12 | 353,841 | +12 | 396,647 |
Hanover County | 86,320 | +16 | 99,863 | +9 | 109,244 | +9 | 119,360 |
Henrico County | 262,300 | +17 | 306,935 | +8 | 332,103 | +9 | 363,259 |
Richmond city | 197,790 | +3 | 204,214 | +14 | 232,533 | +6 | 245,483 |
Total Working Age Population:
Total Households:
Total Working Age Population:
Total Households:
Total Working Age Population:
Total Households: