Retail Space
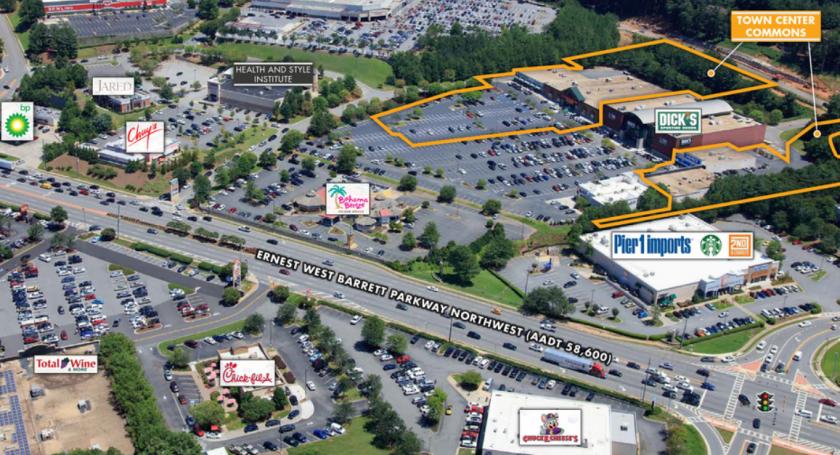
735 Ernest W Barrett Parkway Northwest Kennesaw, GA 30144
735 Ernest W Barrett Parkway Northwest Kennesaw, GA 30144
Details & Description
Property Highlights
- • Available 7,800 SF
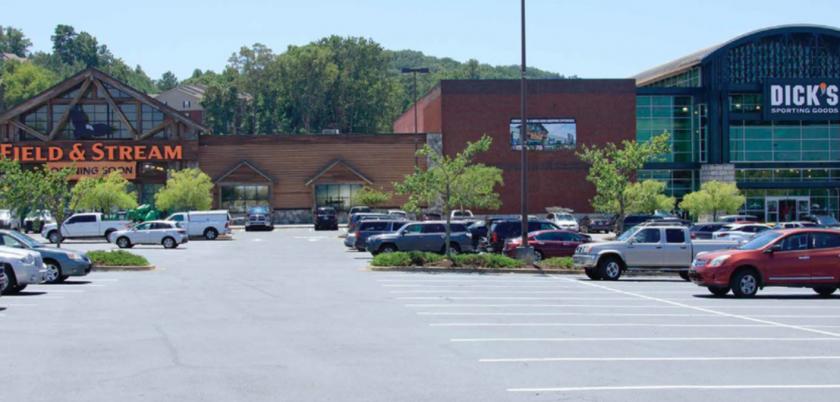
- • GLA 72,168 SF
- • Signalized access from Ernest Barrett Pkwy
Listing Agents

Brett Fuller
O: 770-955-2434
brett.fuller@tscg.com
O: 770-955-2434
brett.fuller@tscg.com
While we strive to provide the most accurate information, all listing information, and demographic data, is provided by third-parties. As such, MyEListing will not be responsible for the accuracy of the information. It is strongly recommended that you verify all information with the listing agent, and any relevant agencies, prior to making any decisions.