Retail Space
1430 Towne Lake Parkway Woodstock, GA 30189
1430 Towne Lake Parkway Woodstock, GA 30189
Details & Description
Property Highlights
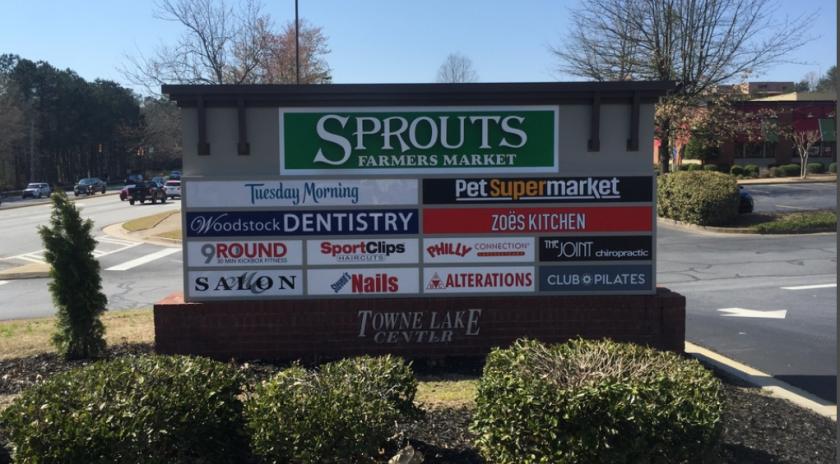
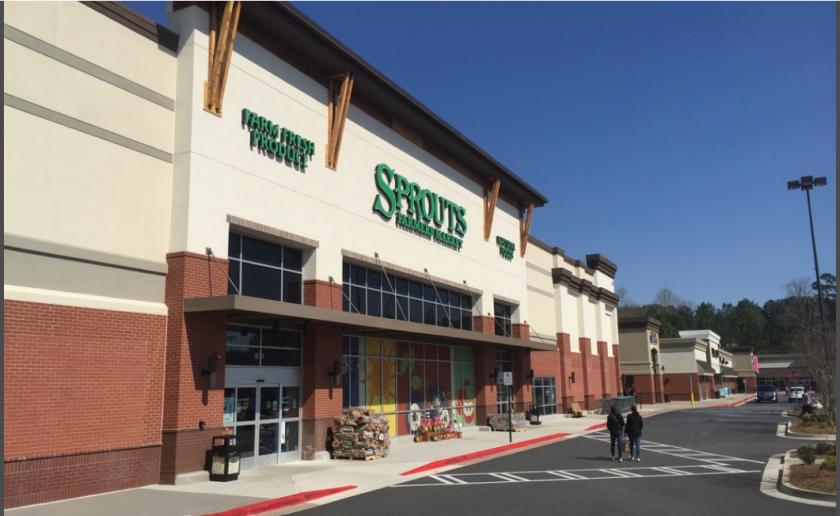
- • Available space in Sprouts anchored center
- • Half a mile from I-575
- • Please do not disturb tenants
- • 5 points of access with a signalized intersection
Listing Agents

Alan Shaw
O: 770-955-2434
alan.shaw@tscg.com
O: 770-955-2434
alan.shaw@tscg.com

Drew Lewis
TSCG
O: 770-955-2434
drew.lewis@tscg.com
TSCG
O: 770-955-2434
drew.lewis@tscg.com
While we strive to provide the most accurate information, all listing information, and demographic data, is provided by third-parties. As such, MyEListing will not be responsible for the accuracy of the information. It is strongly recommended that you verify all information with the listing agent, and any relevant agencies, prior to making any decisions.