Retail Space
2900 Peachtree Road Northwest Atlanta, GA 30305
2900 Peachtree Road Northwest Atlanta, GA 30305
Details & Description
Property Highlights
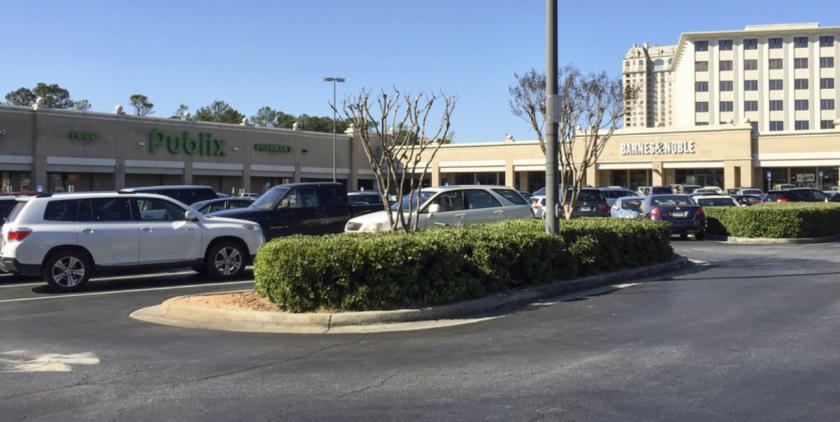
• Excellent visibility with 1,100 linear feet of frontage along Peachtree Rd. and access to three traffic signals
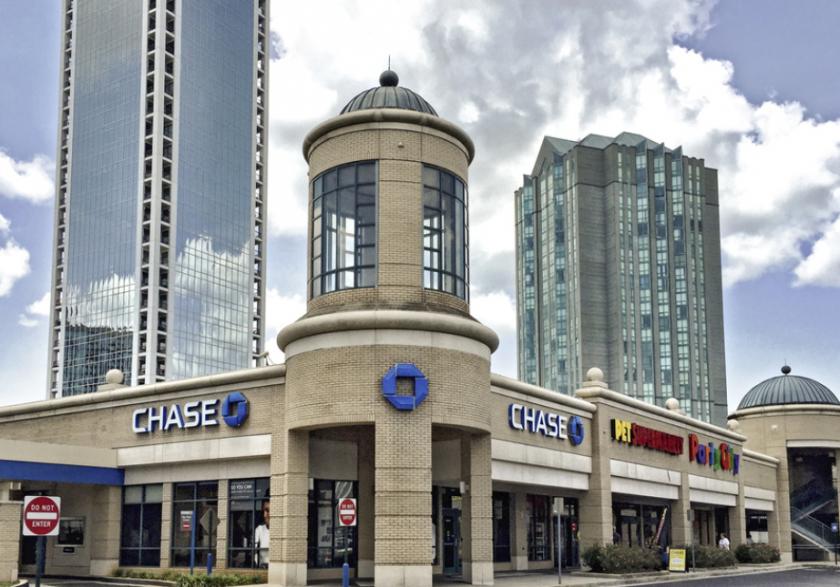
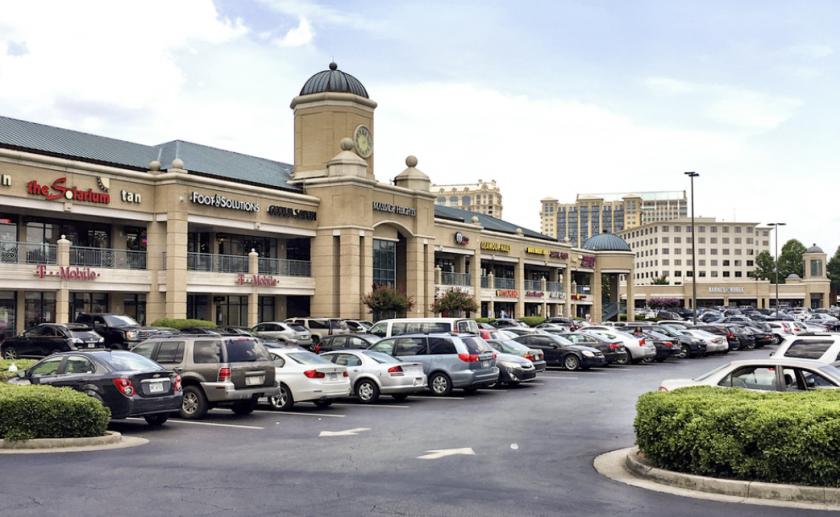
• Premier Buckhead shopping destination anchored by Publix, Barnes Noble and Party City
Listing Agents

Alan Shaw
O: 770-955-2434
alan.shaw@tscg.com
O: 770-955-2434
alan.shaw@tscg.com

Drew Lewis
TSCG
O: 770-955-2434
drew.lewis@tscg.com
TSCG
O: 770-955-2434
drew.lewis@tscg.com
While we strive to provide the most accurate information, all listing information, and demographic data, is provided by third-parties. As such, MyEListing will not be responsible for the accuracy of the information. It is strongly recommended that you verify all information with the listing agent, and any relevant agencies, prior to making any decisions.