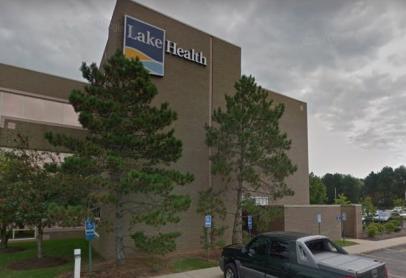
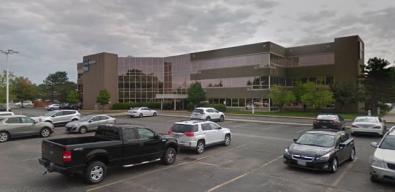
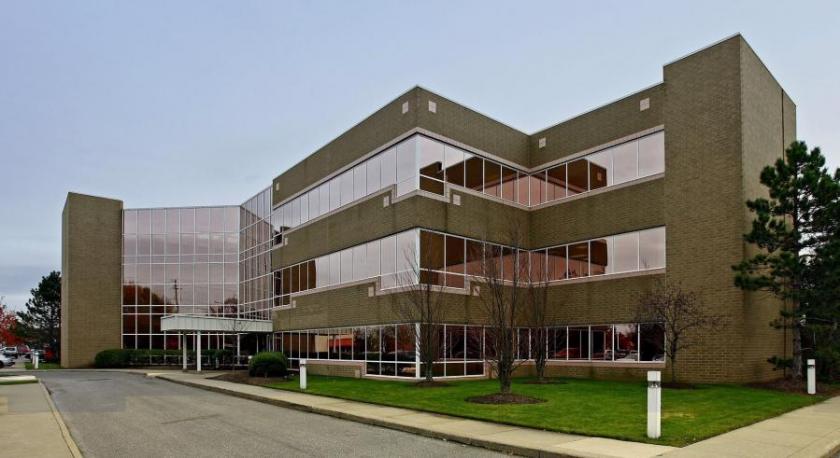
1-Mile | 3-Miles | 5-Miles | ||
---|---|---|---|---|
Total Population | 6,851 | 41,578 | 102,721 | |
Population Median Age | 48 | 44 | 42 | |
Population by Age | 0-9 Yrs | 555 (8%) | 3969 (9%) | 10670 (10%) |
10-19 Yrs | 705 (10%) | 4985 (11%) | 12774 (12%) | |
20-29 Yrs | 436 (6%) | 3936 (9%) | 11483 (11%) | |
30-39 Yrs | 723 (10%) | 4343 (10%) | 11324 (11%) | |
40-49 Yrs | 833 (12%) | 5335 (12%) | 12760 (12%) | |
50-59 Yrs | 944 (13%) | 5966 (14%) | 15213 (14%) | |
60-69 Yrs | 1279 (18%) | 6441 (15%) | 14798 (14%) | |
70+ Yrs | 1376 (20%) | 6603 (15%) | 13699 (13%) | |
Median HH Income | $74,008 | $76,165 | $68,626 | |
Total Household Income | < 24K | 381 (13%) | 2192 (12%) | 5958 (14%) |
25-49K | 589 (20%) | 3598 (20%) | 9397 (22%) | |
50-74K | 500 (17%) | 2752 (15%) | 7425 (17%) | |
75-99K | 451 (15%) | 2890 (16%) | 6471 (15%) | |
100-199K | 796 (27%) | 4890 (28%) | 10387 (24%) | |
200K+ | 180 (6%) | 1031 (5%) | 2368 (5%) | |
Highest Education Level | No Diploma | 350 | 1719 | 5925 |
Diploma or GED | 1804 | 8564 | 22076 | |
Some College | 1136 | 6853 | 16107 | |
Assoc. Degree | 404 | 3008 | 7652 | |
Bachelors Degree | 1044 | 6555 | 13912 | |
Higher Degree | 660 | 4037 | 8066 | |
Total Housing Units | 3,098 | 18,424 | 44,624 | |
--Owner-Occupied | 2,547 | 14,186 | 32,224 | |
--Renter-Occupied | 349 | 3,167 | 9,780 | |
Owner-Occupied Values | < 100K | 447 | 2279 | 5873 |
100-199K | 853 | 5679 | 14412 | |
200-299K | 1032 | 4681 | 8068 | |
300-399K | 176 | 973 | 2282 | |
400-499K | 39 | 370 | 784 | |
500K+ | 0 | 205 | 805 | |
Total Working Age Population | 5,765 | 34,222 | 84,194 | |
In Work Force | 3,258 | 21,718 | 54,310 | |
Not In Work Force | 2,507 | 12,504 | 29,884 | |
Workforce Employed | 3,224 | 20,897 | 52,067 | |
Workforce Unemployed | 33 | 820 | 2,221 | |
Civlian Workforce | 3,258 | 21,717 | 54,288 | |
Military Workforce | 0 | 1 | 22 | |
Total Households | 2,897 | 17,353 | 42,005 | |
Family Households | 1,956 | 11,443 | 27,309 | |
Non-Family Households | 940 | 5,910 | 14,696 | |
Married Couple | 1,554 | 9,023 | 21,130 | |
Other Family | 403 | 2,420 | 6,180 | |
Married w/Child | 460 | 3,079 | 7,301 | |
Single Male w/Child | 65 | 433 | 967 | |
Single Female w/Child | 124 | 726 | 2,043 |
Population Change Last Two Decades - Plus Projection
2000 | % | 2010 | % | 2020 | % | 2030 | |
---|---|---|---|---|---|---|---|
Ohio | 11,353,140 | +2 | 11,536,504 | 0 | 11,574,870 | 0 | 11,615,100 |
Cuyahoga County | 1,393,978 | -8 | 1,280,122 | -6 | 1,209,550 | -5 | 1,154,210 |
Geauga County | 90,895 | +3 | 93,389 | 0 | 93,510 | +2 | 94,930 |
Lake County | 227,511 | +1 | 230,041 | -1 | 228,600 | 0 | 228,380 |
Total Working Age Population:
Total Households:
Total Working Age Population:
Total Households:
Total Working Age Population:
Total Households: